The following data were taken from a research article in the Canadian Journal of Fisheries and Aquatic Sciences, Vol. 57, page 126-127 (2000). The study examined the concentration of various heavy metals in the soft tissues of 2 species of snails in two different lakes along the St. Lawrence River. Cadmium (Cd) levels (microgram/gram dry weight) in soft tissues of Physa gyrina collected in Lake St. Pierre (LSP) and in Lake St. Louis (LSL) in 1990 and 1991 respectively. LSL LSP 7.46 1.02 0.64 1.15 0.40 3.74 0.77 0.71 2.24 0.77 0.96 0.37 0.75 0.45 1.33 1.91 1.00 0.85 Use the t test to determine if there is a significant difference in the Cadmium concentration in snail soft tissue between the two lakes. 1. State your null hypothesis (Ho) 2. Calculaten (sample size for each lake) 3. Calculate x (mean) for each lake 4. Calculate the Variance (s²) for each lake 5. Plug your values into the t test equation and find “calculated t" 6. Determine the df (degrees of freedom) 7. Look up “critical t" with a p value of 0.05 8. Accept of Reject the null hypothesis 9. Conclude if there is a statistical difference or not between the soft tissue levels of Cd in snails from these two lakes.
The following data were taken from a research article in the Canadian Journal of Fisheries and Aquatic Sciences, Vol. 57, page 126-127 (2000). The study examined the concentration of various heavy metals in the soft tissues of 2 species of snails in two different lakes along the St. Lawrence River. Cadmium (Cd) levels (microgram/gram dry weight) in soft tissues of Physa gyrina collected in Lake St. Pierre (LSP) and in Lake St. Louis (LSL) in 1990 and 1991 respectively. LSL LSP 7.46 1.02 0.64 1.15 0.40 3.74 0.77 0.71 2.24 0.77 0.96 0.37 0.75 0.45 1.33 1.91 1.00 0.85 Use the t test to determine if there is a significant difference in the Cadmium concentration in snail soft tissue between the two lakes. 1. State your null hypothesis (Ho) 2. Calculaten (sample size for each lake) 3. Calculate x (mean) for each lake 4. Calculate the Variance (s²) for each lake 5. Plug your values into the t test equation and find “calculated t" 6. Determine the df (degrees of freedom) 7. Look up “critical t" with a p value of 0.05 8. Accept of Reject the null hypothesis 9. Conclude if there is a statistical difference or not between the soft tissue levels of Cd in snails from these two lakes.

Linear Algebra: A Modern Introduction
4th Edition
ISBN:9781285463247
Author:David Poole
Publisher:David Poole
Chapter7: Distance And Approximation
Section7.3: Least Squares Approximation
Problem 31EQ

Related questions
Topic Video
Question
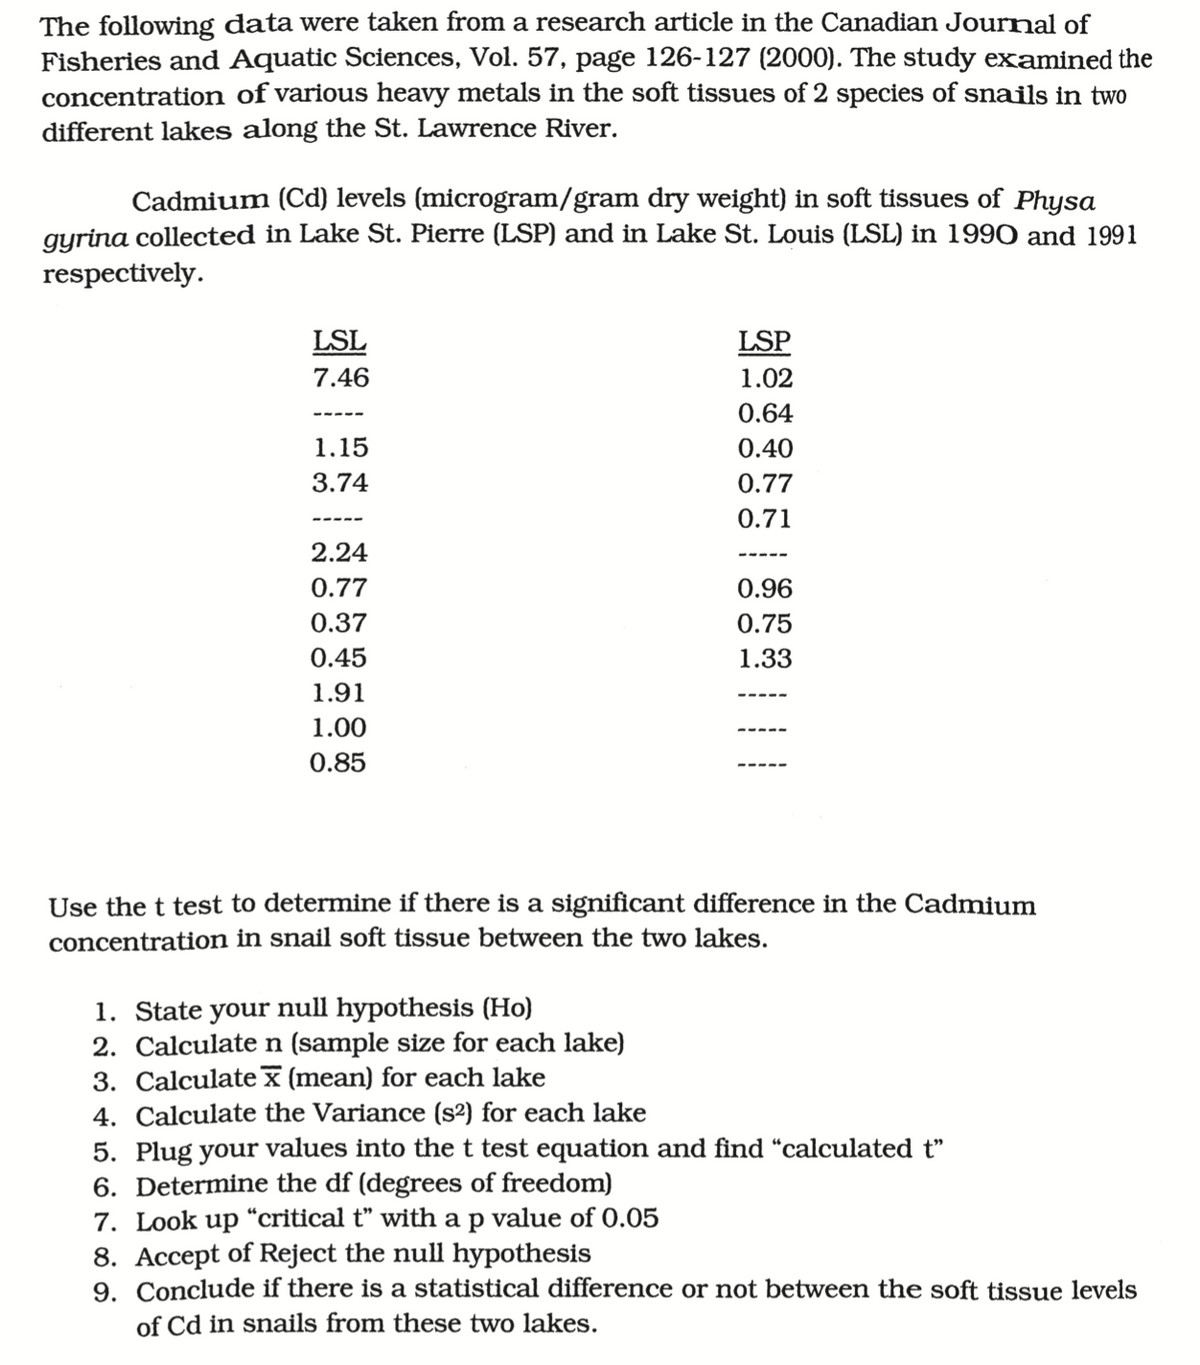
Transcribed Image Text:The following data were taken from a research article in the Canadian Journal of
Fisheries and Aquatic Sciences, Vol. 57, page 126-127 (2000). The study examined the
concentration of various heavy metals in the soft tissues of 2 species of snails in two
different lakes along the St. Lawrence River.
Cadmium (Cd) levels (microgram/gram dry weight) in soft tissues of Physa
gyrina collected in Lake St. Pierre (LSP) and in Lake St. Louis (LSL) in 1990 and 1991
respectively.
LSL
LSP
7.46
1.02
0.64
1.15
0.40
3.74
0.77
0.71
2.24
-----
0.77
0.96
0.37
0.75
0.45
1.33
1.91
1.00
0.85
Use the t test to determine if there is a significant difference in the Cadmium
concentration in snail soft tissue between the two lakes.
1. State your null hypothesis (Ho)
2. Calculaten (sample size for each lake)
3. Calculatex(mean) for each lake
4. Calculate the Variance (s²) for each lake
5. Plug your values into the t test equation and find "calculated t"
6. Determine the df (degrees of freedom)
7. Look up “critical t" with a p value of 0.05
8. Accept of Reject the null hypothesis
9. Conclude if there is a statistical difference or not between the soft tissue levels
of Cd in snails from these two lakes.
Expert Solution
This question has been solved!
Explore an expertly crafted, step-by-step solution for a thorough understanding of key concepts.

Step by step
Solved in 3 steps with 1 images

Knowledge Booster


Learn more about
Need a deep-dive on the concept behind this application? Look no further. Learn more about this topic, statistics and related others by exploring similar questions and additional content below.Recommended textbooks for you
Linear Algebra: A Modern Introduction
Algebra
ISBN:
9781285463247
Author:
David Poole
Publisher:
Cengage Learning

Glencoe Algebra 1, Student Edition, 9780079039897…
Algebra
ISBN:
9780079039897
Author:
Carter
Publisher:
McGraw Hill
Linear Algebra: A Modern Introduction
Algebra
ISBN:
9781285463247
Author:
David Poole
Publisher:
Cengage Learning
Glencoe Algebra 1, Student Edition, 9780079039897…
Algebra
ISBN:
9780079039897
Author:
Carter
Publisher:
McGraw Hill