A study was conducted that resulted in the following relative frequency histogram. Determine whether or not the histogram indicates that a normal distribution could be used as a model for the variable. 0.4- 0.2- 0- 100 3000 4000 2000 5000 Choose the correct answer below. O A. The histogram is bell-shaped, so a normal distribution could be used as a model for the variable. O B. The histogram is not bell-shaped, so a normal distribution could not be used as a model for the variable. O C. The histogram is not bell-shaped, so a normal distribution could be used as a model for the variable. O D. The histogram is bell-shaped, so a normal distribution could not be used as a model for the variable.
A study was conducted that resulted in the following relative frequency histogram. Determine whether or not the histogram indicates that a normal distribution could be used as a model for the variable. 0.4- 0.2- 0- 100 3000 4000 2000 5000 Choose the correct answer below. O A. The histogram is bell-shaped, so a normal distribution could be used as a model for the variable. O B. The histogram is not bell-shaped, so a normal distribution could not be used as a model for the variable. O C. The histogram is not bell-shaped, so a normal distribution could be used as a model for the variable. O D. The histogram is bell-shaped, so a normal distribution could not be used as a model for the variable.

Glencoe Algebra 1, Student Edition, 9780079039897, 0079039898, 2018
18th Edition
ISBN:9780079039897
Author:Carter
Publisher:Carter
Chapter10: Statistics
Section10.4: Distributions Of Data
Problem 19PFA

Related questions

Topic Video
Question
Can I get some help please?
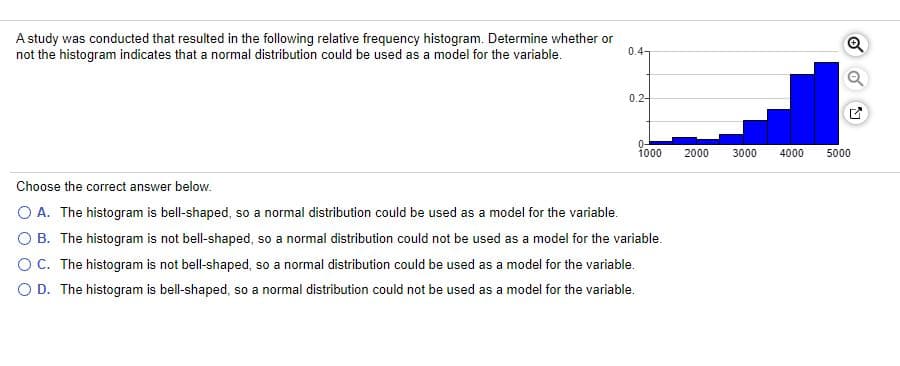
Transcribed Image Text:A study was conducted that resulted in the following relative frequency histogram. Determine whether or
not the histogram indicates that a normal distribution could be used as a model for the variable.
0.4-
0.2-
1000
2000
3000
4000
5000
Choose the correct answer below.
O A. The histogram is bell-shaped, so a normal distribution could be used as a model for the variable.
B. The histogram is not bell-shaped, so a normal distribution could not be used as a model for the variable.
OC. The histogram is not bell-shaped, so a normal distribution could be used as a model for the variable.
O D. The histogram is bell-shaped, so a normal distribution could not be used as a model for the variable.
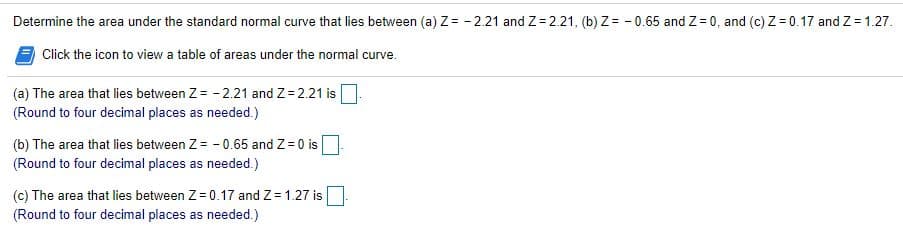
Transcribed Image Text:Determine the area under the standard normal curve that lies between (a) Z= - 2.21 and Z= 2.21, (b) Z= - 0.65 and Z = 0, and (c) Z= 0.17 and Z= 1.27.
Click the icon to view a table of areas under the normal curve.
(a) The area that lies between Z = - 2.21 and Z= 2.21 is
(Round to four decimal places as needed.)
(b) The area that lies between Z = - 0.65 and Z = 0 is
(Round to four decimal places as needed.)
(c) The area that lies between Z = 0.17 and Z = 1.27 is
(Round to four decimal places as needed.)
Expert Solution
This question has been solved!
Explore an expertly crafted, step-by-step solution for a thorough understanding of key concepts.

This is a popular solution!

Trending now
This is a popular solution!

Step by step
Solved in 2 steps

Knowledge Booster


Learn more about
Need a deep-dive on the concept behind this application? Look no further. Learn more about this topic, statistics and related others by exploring similar questions and additional content below.Recommended textbooks for you
Glencoe Algebra 1, Student Edition, 9780079039897…
Algebra
ISBN:
9780079039897
Author:
Carter
Publisher:
McGraw Hill
Glencoe Algebra 1, Student Edition, 9780079039897…
Algebra
ISBN:
9780079039897
Author:
Carter
Publisher:
McGraw Hill