A study was conducted to detemine whether the final grade of a student in STA 2260 course is linearly related to his or her performance on the Normal-Distribution Webwork assignment. The Webwork scores and final grades for 10 students are shown in the table below. Student Webwork Score x Final Grade y 1 73 90 2 69 79 3 32 42 4 75 91 5 76 94 6 70 80 7 60 74 8 45 55 9 43 53 10 61 76 Find the following: a) Compute the value of SST (Total Sum of Squares) answer: (b) Compute the value of SSR (Regression Sum of Squares) answer: (c) Compute the value of SSE (Error Sum of Squares) answer: (d) The coefficient of determination is answer: (e) What percent of variation in the observed values of the response variable is explained by the regression? answer:


Correlation
Correlation defines a relationship between two independent variables. It tells the degree to which variables move in relation to each other. When two sets of data are related to each other, there is a correlation between them.
Linear Correlation
A correlation is used to determine the relationships between numerical and categorical variables. In other words, it is an indicator of how things are connected to one another. The correlation analysis is the study of how variables are related.
Regression Analysis
Regression analysis is a statistical method in which it estimates the relationship between a dependent variable and one or more independent variable. In simple terms dependent variable is called as outcome variable and independent variable is called as predictors. Regression analysis is one of the methods to find the trends in data. The independent variable used in Regression analysis is named Predictor variable. It offers data of an associated dependent variable regarding a particular outcome.
A study was conducted to detemine whether the final grade of a student in STA 2260 course is linearly related to his or her performance on the Normal-Distribution Webwork assignment. The Webwork scores and final grades for 10 students are shown in the table below.
| Student | Webwork Score x | Final Grade y |
| 1 | 73 | 90 |
| 2 | 69 | 79 |
| 3 | 32 | 42 |
| 4 | 75 | 91 |
| 5 | 76 | 94 |
| 6 | 70 | 80 |
| 7 | 60 | 74 |
| 8 | 45 | 55 |
| 9 | 43 | 53 |
| 10 | 61 | 76 |
Find the following:
a) Compute the value of SST (Total Sum of Squares)
answer:
(b) Compute the value of SSR (Regression Sum of Squares)
answer:
(c) Compute the value of SSE (Error Sum of Squares)
answer:
(d) The coefficient of determination is
answer:
(e) What percent of variation in the observed values of the response variable is explained by the regression?
answer:
(a)
Use EXCEL to obtain the value of SST
EXCEL procedure:
- Go to EXCEL
- Go to Data>Data Analysis.
- Choose Regression.
- Input Y range as $A$1:$A$11.
- Input X range as $B$1:$C$11.
- Check the option Labels in First row.
- Click OK.
EXCEL output:
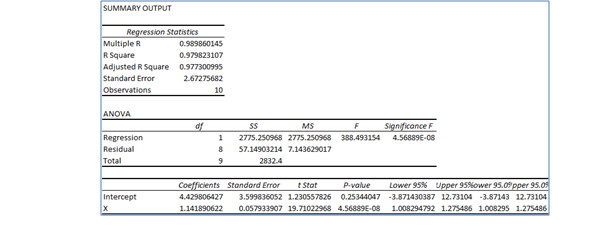
From the EXCEL output,
The value of SST is 2832.4

Step by step
Solved in 2 steps with 1 images


