A study was conducted to determine the proportion of people who dream in black and white instead of color. Among 314 people over the age of 55, 77 dream in and white, and among 283 people under the age of 25, 18 dream in black and white. Use a 0.01 significance level to test the claim that the proportion of people c who dream in black and white is greater than the proportion for those under 25. Complete parts (a) through (c) below. a. Test the claim using a hypothesis test. Consider the first sample to be the sample of people over the age of 55 and the second sample to be the sample of people under the age of 25. What are the nul alternative hypotheses for the hypothesis test? O A. Ho: P1 = P2 O B. Ho: P1 = P2 H1: P1 #P2 O C. Ho: P1 SP2 H1: P1 #P2 H1:P1 P2 H1: P1 #P2 Identify the test statistic. z= (Round to two decimal places as needed.) Identify the P-value. P-value =
A study was conducted to determine the proportion of people who dream in black and white instead of color. Among 314 people over the age of 55, 77 dream in and white, and among 283 people under the age of 25, 18 dream in black and white. Use a 0.01 significance level to test the claim that the proportion of people c who dream in black and white is greater than the proportion for those under 25. Complete parts (a) through (c) below. a. Test the claim using a hypothesis test. Consider the first sample to be the sample of people over the age of 55 and the second sample to be the sample of people under the age of 25. What are the nul alternative hypotheses for the hypothesis test? O A. Ho: P1 = P2 O B. Ho: P1 = P2 H1: P1 #P2 O C. Ho: P1 SP2 H1: P1 #P2 H1:P1 P2 H1: P1 #P2 Identify the test statistic. z= (Round to two decimal places as needed.) Identify the P-value. P-value =

Holt Mcdougal Larson Pre-algebra: Student Edition 2012
1st Edition
ISBN:9780547587776
Author:HOLT MCDOUGAL
Publisher:HOLT MCDOUGAL
Chapter11: Data Analysis And Probability
Section: Chapter Questions
Problem 8CR

Related questions

Topic Video
Question
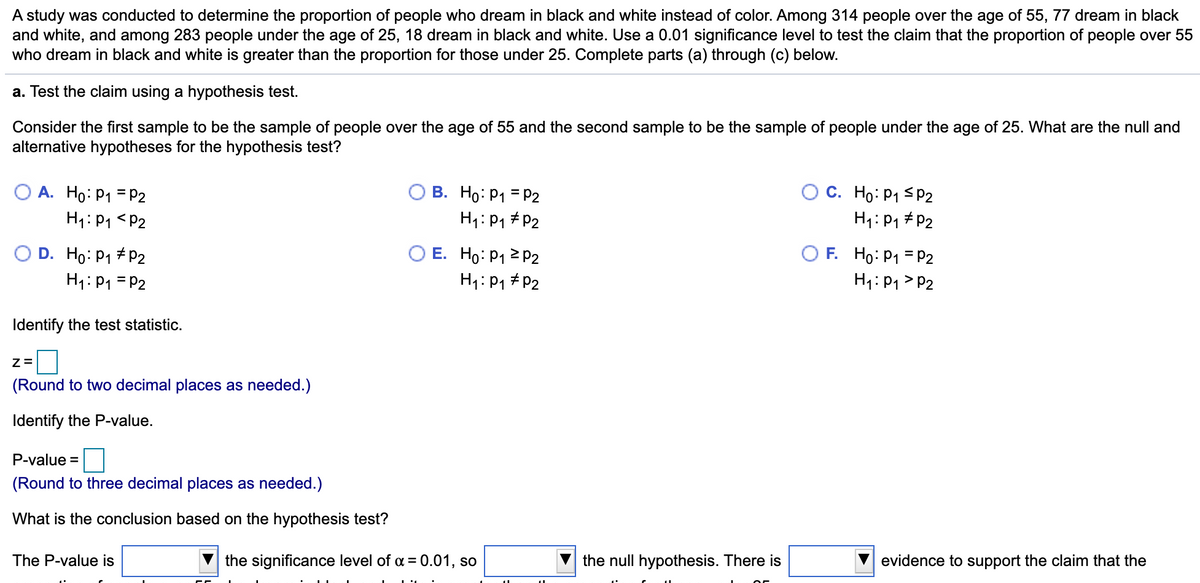
Transcribed Image Text:A study was conducted to determine the proportion of people who dream in black and white instead of color. Among 314 people over the age of 55, 77 dream in black
and white, and among 283 people under the age of 25, 18 dream in black and white. Use a 0.01 significance level to test the claim that the proportion of people over 55
who dream in black and white is greater than the proportion for those under 25. Complete parts (a) through (c) below.
a. Test the claim using a hypothesis test.
Consider the first sample to be the sample of people over the age of 55 and the second sample to be the sample of people under the age of 25. What are the null and
alternative hypotheses for the hypothesis test?
O A. Ho: P1 = P2
H1: P1 <P2
C. Ho: P1 <P2
H1: P1 # P2
B. Ho: P1 = P2
H1: P1 #P2
O D. Ho: P1 # P2
H1: P1 = P2
O E. Ho: P1 2 P2
H1: P1 # P2
O F. Ho: P1 = P2
H1: P1 > P2
Identify the test statistic.
(Round to two decimal places as needed.)
Identify the P-value.
P-value =
(Round to three decimal places as needed.)
What is the conclusion based on the hypothesis test?
The P-value is
the significance level of a = 0.01, so
the null hypothesis. There is
evidence to support the claim that the
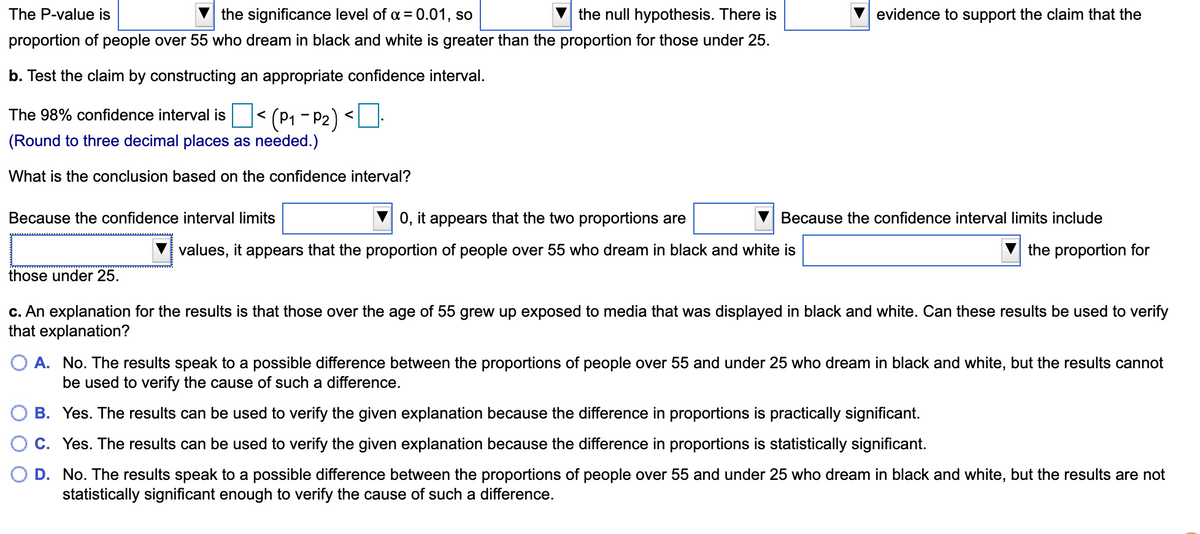
Transcribed Image Text:The P-value is
the significance level of a = 0.01, so
the null hypothesis. There is
evidence to support the claim that the
proportion of people over 55 who dream in black and white is greater than the proportion for those under 25.
b. Test the claim by constructing an appropriate confidence interval.
(P1 - P2) <.
(Round to three decimal places as needed.)
The 98% confidence interval is
<
What is the conclusion based on the confidence interval?
Because the confidence interval limits
0, it appears that the two proportions are
Because the confidence interval limits include
values, it appears that the proportion of people over 55 who dream in black and white is
the proportion for
those under 25.
c. An explanation for the results is that those over the age of 55 grew up exposed to media that was displayed in black and white. Can these results be used to verify
that explanation?
O A. No. The results speak to a possible difference between the proportions of people over 55 and under 25 who dream in black and white, but the results cannot
be used to verify the cause of such a difference.
O B. Yes. The results can be used to verify the given explanation because the difference in proportions is practically significant.
C. Yes. The results can be used to verify the given explanation because the difference in proportions is statistically significant.
D. No. The results speak to a possible difference between the proportions of people over 55 and under 25 who dream in black and white, but the results are not
statistically significant enough to verify the cause of such a difference.
Expert Solution
This question has been solved!
Explore an expertly crafted, step-by-step solution for a thorough understanding of key concepts.

This is a popular solution!

Trending now
This is a popular solution!

Step by step
Solved in 2 steps

Knowledge Booster


Learn more about
Need a deep-dive on the concept behind this application? Look no further. Learn more about this topic, statistics and related others by exploring similar questions and additional content below.Recommended textbooks for you
Holt Mcdougal Larson Pre-algebra: Student Edition…
Algebra
ISBN:
9780547587776
Author:
HOLT MCDOUGAL
Publisher:
HOLT MCDOUGAL

Glencoe Algebra 1, Student Edition, 9780079039897…
Algebra
ISBN:
9780079039897
Author:
Carter
Publisher:
McGraw Hill

College Algebra (MindTap Course List)
Algebra
ISBN:
9781305652231
Author:
R. David Gustafson, Jeff Hughes
Publisher:
Cengage Learning
Holt Mcdougal Larson Pre-algebra: Student Edition…
Algebra
ISBN:
9780547587776
Author:
HOLT MCDOUGAL
Publisher:
HOLT MCDOUGAL
Glencoe Algebra 1, Student Edition, 9780079039897…
Algebra
ISBN:
9780079039897
Author:
Carter
Publisher:
McGraw Hill
College Algebra (MindTap Course List)
Algebra
ISBN:
9781305652231
Author:
R. David Gustafson, Jeff Hughes
Publisher:
Cengage Learning
