A veterinarian is interested in researching the proportion of men and women cat owners and believes that the proportion of men cat owners is significantly different than the proportion of women cat owners. The veterinarian decides to obtain two independent samples of men and women cat owners and finds from one sample of 60 men, 45% owned cats. In the second sample of 80 women, 70% owned cats. Test the veterinarian's belief at the a = 0.1 significance level.
A veterinarian is interested in researching the proportion of men and women cat owners and believes that the proportion of men cat owners is significantly different than the proportion of women cat owners. The veterinarian decides to obtain two independent samples of men and women cat owners and finds from one sample of 60 men, 45% owned cats. In the second sample of 80 women, 70% owned cats. Test the veterinarian's belief at the a = 0.1 significance level.

Holt Mcdougal Larson Pre-algebra: Student Edition 2012
1st Edition
ISBN:9780547587776
Author:HOLT MCDOUGAL
Publisher:HOLT MCDOUGAL
Chapter11: Data Analysis And Probability
Section: Chapter Questions
Problem 8CR

Related questions

Question

Transcribed Image Text:11/15/2020
MyOpenMath
There is enough evidence to support the veterinarian's belief.
There is not enough evidence to support the veterinarian's belief.
https://www.myopenmath.com/assess2/?cid380488&aid3D5754731#/print
6/6
Transcribed Image Text:11/15/2020
MyOpenMath
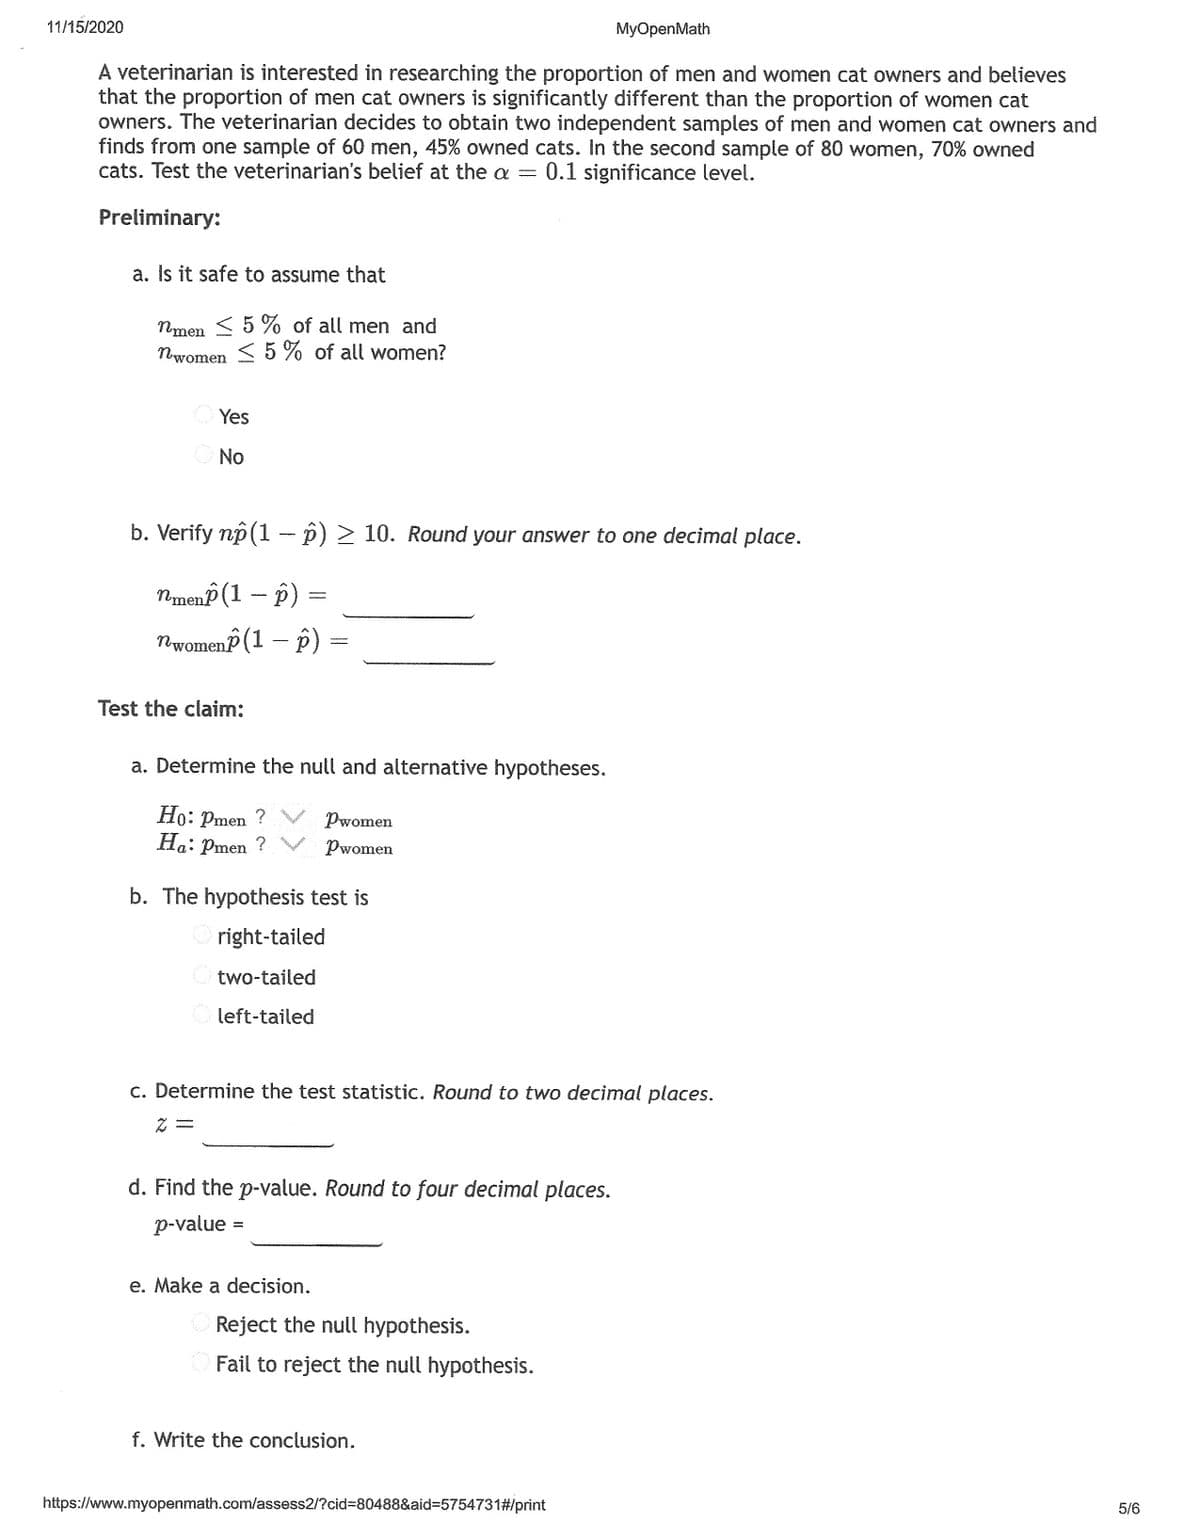
A veterinarian is interested in researching the proportion of men and women cat owners and believes
that the proportion of men cat owners is significantly different than the proportion of women cat
owners. The veterinarian decides to obtain two independent samples of men and women cat owners and
finds from one sample of 60 men, 45% owned cats. In the second sample of 80 women, 70% owned
cats. Test the veterinarian's belief at the a = 0.1 significance level.
Preliminary:
a. Is it safe to assume that
Nmen < 5 % of all men and
nwomen < 5 % of all women?
Yes
No
b. Verify np (1 - p) > 10. Round your answer to one decimal place.
NmenP (1 - p) =
ПwomenP (1 — p) %3
Test the claim:
a. Determine the null and alternative hypotheses.
Но: Рmen ?
Ha: Pmen ?
Pwomen
Pwomen
b. The hypothesis test is
right-tailed
two-tailed
left-tailed
c. Determine the test statistic. Round to two decimal places.
d. Find the p-value. Round to four decimal places.
p-value
e. Make a decision.
Reject the null hypothesis.
Fail to reject the null hypothesis.
f. Write the conclusion.
https://www.myopenmath.com/assess2/?cid%380488&aid%3D5754731#/print
5/6
Expert Solution
This question has been solved!
Explore an expertly crafted, step-by-step solution for a thorough understanding of key concepts.

This is a popular solution!

Trending now
This is a popular solution!

Step by step
Solved in 2 steps

Knowledge Booster


Learn more about
Need a deep-dive on the concept behind this application? Look no further. Learn more about this topic, statistics and related others by exploring similar questions and additional content below.Recommended textbooks for you
Holt Mcdougal Larson Pre-algebra: Student Edition…
Algebra
ISBN:
9780547587776
Author:
HOLT MCDOUGAL
Publisher:
HOLT MCDOUGAL
Holt Mcdougal Larson Pre-algebra: Student Edition…
Algebra
ISBN:
9780547587776
Author:
HOLT MCDOUGAL
Publisher:
HOLT MCDOUGAL