A study was conducted to investigate the effect of a coal-fired generating plant upon the water quality of a river. As part of an environmental impact study, fish were captured, tagged, and released. The following information was recorded for each fish: sex (0=female, 1=male), length (cm), maturation (0=young, 1=adult), weight (g). The level of these data is ordinal, ratio, nominal, ratio. nominal, interval, ordinal, ratio. O ordinal, interval, ordinal, ratio. O nominal, ratio, ordinal, ratio. nominal, ratio, nominal, ratio.
A study was conducted to investigate the effect of a coal-fired generating plant upon the water quality of a river. As part of an environmental impact study, fish were captured, tagged, and released. The following information was recorded for each fish: sex (0=female, 1=male), length (cm), maturation (0=young, 1=adult), weight (g). The level of these data is ordinal, ratio, nominal, ratio. nominal, interval, ordinal, ratio. O ordinal, interval, ordinal, ratio. O nominal, ratio, ordinal, ratio. nominal, ratio, nominal, ratio.

Managerial Economics: Applications, Strategies and Tactics (MindTap Course List)
14th Edition
ISBN:9781305506381
Author:James R. McGuigan, R. Charles Moyer, Frederick H.deB. Harris
Publisher:James R. McGuigan, R. Charles Moyer, Frederick H.deB. Harris
Chapter4A: Problems In Applying The Linear Regression Model
Section: Chapter Questions
Problem 2E

Related questions
Question
Question 8
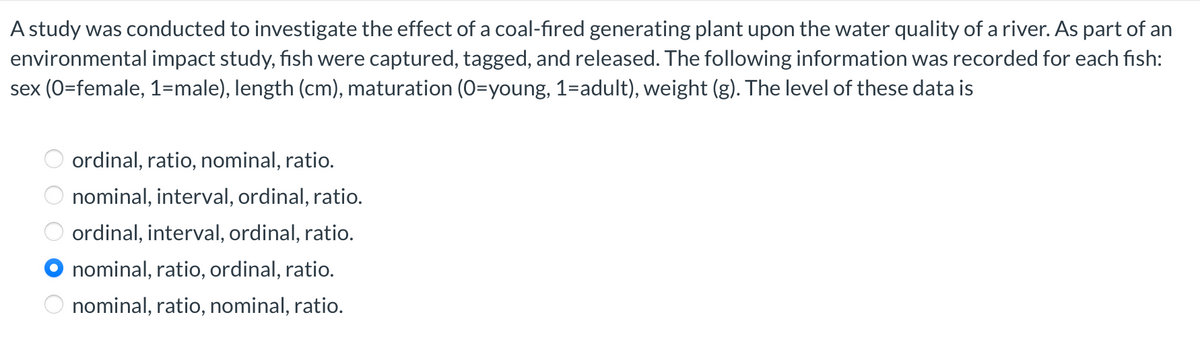
Transcribed Image Text:A study was conducted to investigate the effect of a coal-fired generating plant upon the water quality of a river. As part of an
environmental impact study, fish were captured, tagged, and released. The following information was recorded for each fish:
sex (0=female, 1=male), length (cm), maturation (0=young, 1=adult), weight (g). The level of these data is
ordinal, ratio, nominal, ratio.
nominal, interval, ordinal, ratio.
ordinal, interval, ordinal, ratio.
nominal, ratio, ordinal, ratio.
nominal, ratio, nominal, ratio.
O O O O O
Expert Solution
This question has been solved!
Explore an expertly crafted, step-by-step solution for a thorough understanding of key concepts.

This is a popular solution!

Trending now
This is a popular solution!

Step by step
Solved in 2 steps

Recommended textbooks for you
Managerial Economics: Applications, Strategies an…
Economics
ISBN:
9781305506381
Author:
James R. McGuigan, R. Charles Moyer, Frederick H.deB. Harris
Publisher:
Cengage Learning
Managerial Economics: Applications, Strategies an…
Economics
ISBN:
9781305506381
Author:
James R. McGuigan, R. Charles Moyer, Frederick H.deB. Harris
Publisher:
Cengage Learning