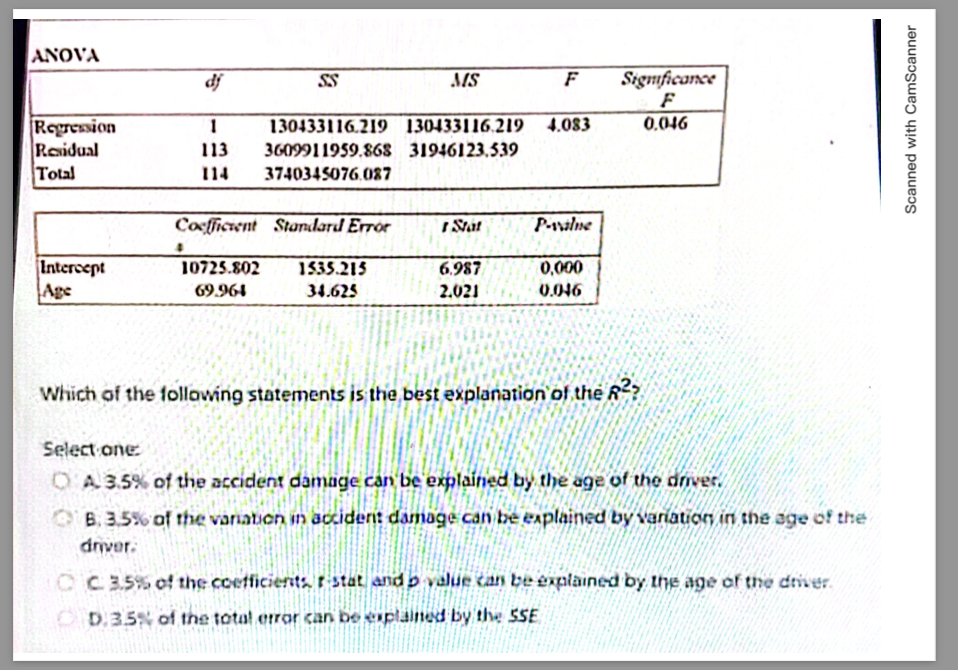
ANOVA Sigmficance F 0,046 df SS MS F 130433116.219 130433116.219 4.083 Regression Residual Total 113 3609911959.86s 31946123.539 114 3740345076.087 Cosfficrent Standard Error Stát Pvalne 1535.215 Intercept Age 10725.802 6.987 0,000 69.964 34.625 2.021 0.046 Which of the following statements is the best explanation of the R? Select one O'A3.5% of the accident damage can be explained by the age of the driver. B. 3.5% of the variation in accidernt damage can be eaplained by variation in the age of the drver. CC3.5% of the coefficients r stat and p value can be explained by the age of the dtver. D.3.5% of the total errar can be eiplained by the SSE Scanned with CamScanner
ANOVA Sigmficance F 0,046 df SS MS F 130433116.219 130433116.219 4.083 Regression Residual Total 113 3609911959.86s 31946123.539 114 3740345076.087 Cosfficrent Standard Error Stát Pvalne 1535.215 Intercept Age 10725.802 6.987 0,000 69.964 34.625 2.021 0.046 Which of the following statements is the best explanation of the R? Select one O'A3.5% of the accident damage can be explained by the age of the driver. B. 3.5% of the variation in accidernt damage can be eaplained by variation in the age of the drver. CC3.5% of the coefficients r stat and p value can be explained by the age of the dtver. D.3.5% of the total errar can be eiplained by the SSE Scanned with CamScanner

Chapter1: Making Economics Decisions
Section: Chapter Questions
Problem 1QTC

Related questions
Question
Transcribed Image Text:ANOVA
Sigmficance
F
0,046
df
SS
MS
F
130433116.219 130433116.219 4.083
Regression
Residual
Total
113
3609911959.86s 31946123.539
114
3740345076.087
Cosfficrent Standard Error
Stát
Pvalne
1535.215
Intercept
Age
10725.802
6.987
0,000
69.964
34.625
2.021
0.046
Which of the following statements is the best explanation of the R?
Select one
O'A3.5% of the accident damage can be explained by the age of the driver.
B. 3.5% of the variation in accidernt damage can be eaplained by variation in the age of the
drver.
CC3.5% of the coefficients r stat and p value can be explained by the age of the dtver.
D.3.5% of the total errar can be eiplained by the SSE
Scanned with CamScanner
Expert Solution
This question has been solved!
Explore an expertly crafted, step-by-step solution for a thorough understanding of key concepts.

Step by step
Solved in 3 steps

Knowledge Booster


Learn more about
Need a deep-dive on the concept behind this application? Look no further. Learn more about this topic, economics and related others by exploring similar questions and additional content below.Recommended textbooks for you

Principles of Economics (12th Edition)
Economics
ISBN:
9780134078779
Author:
Karl E. Case, Ray C. Fair, Sharon E. Oster
Publisher:
PEARSON

Engineering Economy (17th Edition)
Economics
ISBN:
9780134870069
Author:
William G. Sullivan, Elin M. Wicks, C. Patrick Koelling
Publisher:
PEARSON
Principles of Economics (12th Edition)
Economics
ISBN:
9780134078779
Author:
Karl E. Case, Ray C. Fair, Sharon E. Oster
Publisher:
PEARSON
Engineering Economy (17th Edition)
Economics
ISBN:
9780134870069
Author:
William G. Sullivan, Elin M. Wicks, C. Patrick Koelling
Publisher:
PEARSON

Principles of Economics (MindTap Course List)
Economics
ISBN:
9781305585126
Author:
N. Gregory Mankiw
Publisher:
Cengage Learning

Managerial Economics: A Problem Solving Approach
Economics
ISBN:
9781337106665
Author:
Luke M. Froeb, Brian T. McCann, Michael R. Ward, Mike Shor
Publisher:
Cengage Learning

Managerial Economics & Business Strategy (Mcgraw-…
Economics
ISBN:
9781259290619
Author:
Michael Baye, Jeff Prince
Publisher:
McGraw-Hill Education