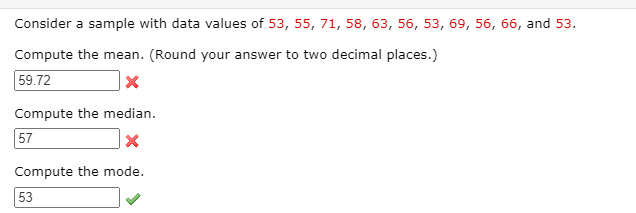
Consider a sample with data values of 53, 55, 71, 58, 63, 56, 53, 69, 56, 66, and 53.


Q: the regression R2 is 0.98.This mean
A: After you have got fit a linear model using multivariate analysis, ANOVA, or design of experiments…
Q: The dependent variable is used to predict the independent variable. Is this True or False
A: The variables are the factors that are not constant and fixed, but changes its value. There could be…
Q: ods which might be use to select the sample households.
A: Answer Specifically for an outsized population, the tactic that is additional in usage is sampling,…
Q: What is the relationship between the $ price of paint and the gallon demand for this paint? A random…
A: Demand(DD) curve is a downward-sloping curve which shows that as price(P) rises, quantity…
Q: Values of height in inches (X) and weight in pounds (Y) are recorded froma sample of 200 male…
A: 1 lb = 0.453592 kg 1 inch = 0.0254 meters
Q: In a study aimed at creating reference values, abdominal circumference (measured in cm) was measured…
A: The provided information are: circumference = 82 + 0.3 x age
Q: Sampling is the main technique for . the size of data from the population size to a manageable size.
A: Sampling is the process of choosing a sample from a larger population for the purpose of statistical…
Q: eBook The national mean annual salary for a school administrator is $90,000 a year. A school…
A:
Q: what kind of sampling technique would you choose, if your objective is to compose a representative…
A: unlimited wants. For production, raw materials are used as inputs and processes through machinery…
Q: Following the increase in price of a 250g bag of coffee from £2.35 to £2.65 in a local supermarket,…
A: The response of a good or service's supply to a change in its market price is measured by its price…
Q: For each of the following variables, determine whether the variable is categorical or numerical. If…
A: Disclaimer :- as you posted multipart questions we are supposed to solve the first 3 questions only.…
Q: Based on the graphical representation below, select the answer which best interprets the graphical…
A: Based on the graphical representation below. This diagram shows two goods X1 and X2.
Q: The survey about the kind of movie they like the best was done between some students. The answers…
A: The kind of movies are:
Q: A wedding photographer made $500 on average in the 5 years it has been operational. Asample of 12…
A: In statistics, population is the entire group that is taken into consideration for a statistical…
Q: Describe A time-ordered sequence of observations taken at regular intervals.
A: A time series is a time-ordered sequence of observations taken at regular intervals over a period of…
Q: What is the lowest level of measurement for the data where the mode could be determined? A. Nominal…
A: 1) Nominal is the lowest level of measurement which is used for determination of mode. It means that…
Q: a 95% confidence interval for B1, the regression slope coefficient. confidence interval for B1, the…
A:
Q: A basket contains 1460 fruits. Using stratified sampling method, a sample of 150 fruits from each…
A: Given:Total sample size=150Total fruits (Entire population)=1460Total plums (Layer size)=584
Q: Sppose we have collected a sample with following characteristics: Total observation = 12 f 20 y = 10…
A: The correlation coefficient measures the degree of association between the two variables. The…
Q: Now suppose that you instead observe the value of exports for all the different products (e.g.,…
A: When we have to observe the value of exports for all the different products (e.g., corn, soybeans,…
Q: A building company claims that 70% of all new houses they build are finished within 3 weeks. A study…
A: Ans
Q: Based on 1337 data points, the following equation was estimated using OLS. From this fragment of…
A:
Q: Select your answer - v b. What does the scatter diagram developed in part (a) indicate about the…
A: (b) Determine the type of relationship exists between the two variables. From the scatter plot…
Q: Manufacturers of tires report that car tires should be able to last an average of 50,000 miles. A…
A: In the mentioned question, they have asked whether the mileage above 51500 is improved or not.
Q: Calculate the coefficient of variation for the following sample data: 10 8 11 7 9
A: Coefficient of variation refers to the measure of variability as the name suggests which is…
Q: Consider the following data:
A: Since the question you have posted consists of multiple parts, we will answer the first question for…
Q: The following 3 observations of variables X and Y were collected. 13 Y 17 24 43 (a) Calculate the…
A: Mean is referred to as the mathematical average of a set of two or more numbers.
Q: A materials engineer wants to understand the relationship between the strength of plastic cases and…
A: Introduction Coefficient of determination is used for the interpretation of coefficient of…
Q: Use General Linear Process to determine the the autocovariance function of mean funchon and ARca)…
A: A function is a formula that expresses one variable in terms of another.The phrase "y is a function…
Q: What do you mean by Scatterplots, the Sample Covariance, and the Sample Correlation?
A: Scatterplot is a display of data type that visualizes the relationship between 2 variables that are…
Q: What level of measurement would be used if participants were asked to choose one picture from a set…
A: A variable is a quantity whose value tends to change across the population and could be measured.…
Q: Test significance of the slope parameter (the parameter of the independent variable) at 5%…
A: We are going to review multiple regression system to answer this question. B1 is the slope parameter…
Q: e (in feet) traveled by a baseball, in degrees) the baseball was hit, or. ent Variable: DISTANCE…
A: *Answer:
Q: A random sample of data for 7 days of operation produced the following (price, quantity) data…
A: Hi! Thank you for the question, As per the honor code, we are allowed to answer three sub-parts at a…
Q: Following results were obtained from an analysis of 12 pairs of observations: N= 12, ΣX - 30, ΣΥ= 5,…
A: Given information with incorrect entries(X= 11, Y= 4):- N = 12 ΣX = 30 ΣY = 05 ΣX2…
Q: 2. To help determine how many beers to stock the concession manager at Yankee Stadium wanted to know…
A: Suppose for the aim of stocking, a concession manager wanted to understand the…
Q: Prepare a scatter plot of the following data:(5, 53) (21, 65) (14, 48) (11, 66) (9, 46) (4, 56)(7,…
A: The data set is: X Y 5 53 21 65 14 48 11 66 9 46 4 56 7 53 21 57 17 49 14 66…
Q: How can we say that Sample Average is the Efficient Linear Estimator of E(Y)?
A: To show that Sample average is the efficient linear estimator of E(Y), we consider the following a…
Q: When considering data metrics, the first task is to define just what we want to occur and what we…
A: There are eight steps in the data metrics evaluation process 1. Identify the data 2. Select Target…
Q: Consider the following regression: Test Score; = 68.12 + 2.52Hours Studied, - 0.04Hours Studied? %3D…
A: The regression function shows the linear relationship between explanatory variables and dependent…
Q: Bank clients were asked to indicate their level of satisfaction with the service provided by the…
A: The data can be plotted on a graph and the graph or diagrams can be many like the bar diagram, line…
Q: Consumption (thousands of dollars) Income (thousands of dollars) 20 18 18 13 27 21 36 27 37 26 45 36…
A: The Keynesian consumption function establishes a relationship between the total consumption of each…
Q: Here are grouped data for heights of 100 randomly selected male students. Find out the skewness and…
A: skewness: Skewness will show the symmetricity of a curve , a curve can have either negatively…
Q: Based on 1337 data points, the following equation was estimated using OLS.From this fragment of data…
A: Given: Ghat: To Find: The residual for 444th data point:
Q: Suppose you are going to conduct a sample survey regarding employee job satisfaction on 20 employees…
A: Sampling can be of two types: - Probability sampling: It is based on purely random methods to obtain…
Q: if the relationship between two variables is linear and the coefficient of determination (R2) has a…
A: If the relationship between two variables is linear and the coefficient determination R2 has a value…


Trending now
This is a popular solution!

Step by step
Solved in 2 steps with 1 images
