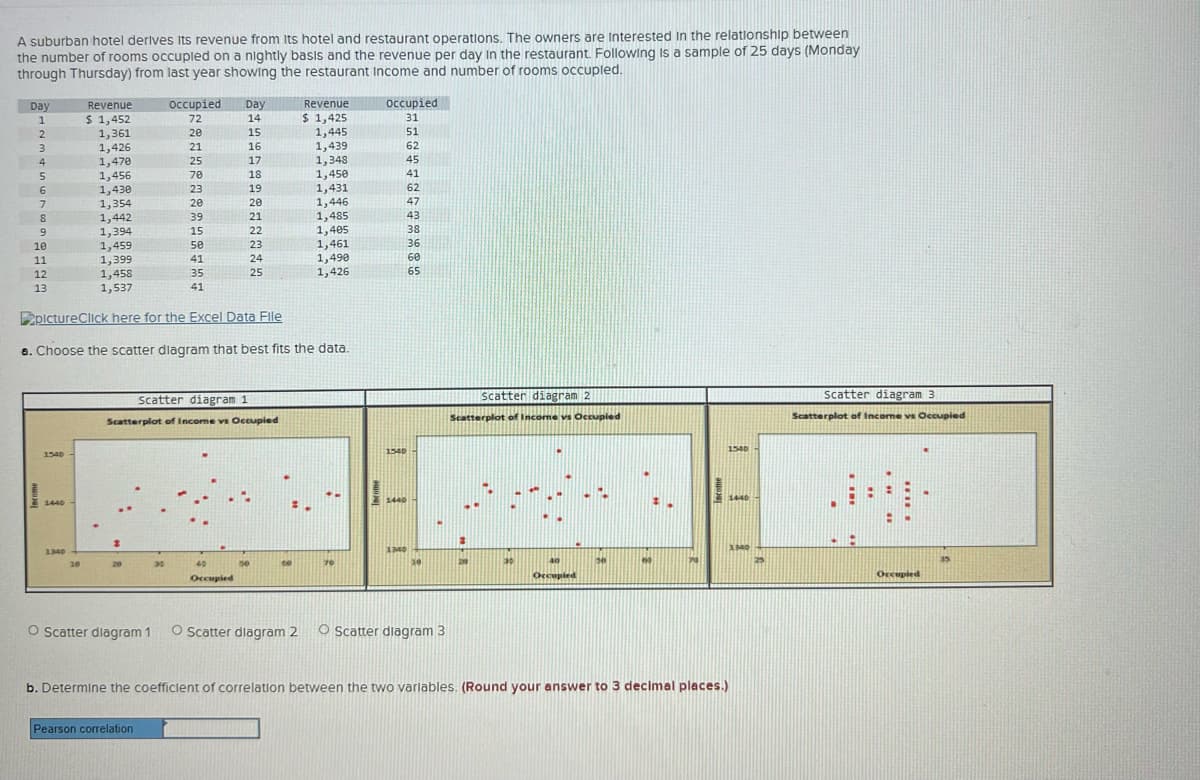
A suburban hotel derives Its revenue from Its hotel and restaurant operations. The owners are Interested in the relationship between the number of rooms occupled on a nightly basis and the revenue per day In the restaurant. Following Is a sample of 25 days (Monday through Thursday) from last year showing the restaurant Income and number of rooms occupled. Revenue $ 1,425 1,445 1,439 1,348 1,450 1,431 1,446 1,485 1,405 1,461 1,490 1,426 Revenue $ 1,452 Occupied 31 Day occupied Day 1 72 14 15 51 1,361 1,426 1,470 1,456 1,430 1,354 1,442 1,394 1,459 1,399 1,458 1,537 2 20 3. 21 16 62 4. 25 17 45 70 18 41 23 19 62 20 20 47 39 21 43 15 22 38 10 50 23 36 11 41 24 60 12 35 25 65 13 41 PpictureClick here for the Excel Data File a. Choose the scatter diagram that best fits the data. Scatter diagram 1 scatter diagram 2 Scatter diagram 3 Scatterplot of Income vs Oecupled Scatterplot of Inceme vs Occupied Scatterplot of Income vs Occupied 1540 1540 1540 1440 1440 1440 1340 140 1340 20 40 se ce 29 50 20 Occupied Occopied Occupled O scatter dlagram 1 O scatter dlagram 2 O Scatter diagram 3 b. Determine the coefficlent of correlation between the two varlables. (Round your answer to 3 decimal places.) Pearson correlation
A suburban hotel derives Its revenue from Its hotel and restaurant operations. The owners are Interested in the relationship between the number of rooms occupled on a nightly basis and the revenue per day In the restaurant. Following Is a sample of 25 days (Monday through Thursday) from last year showing the restaurant Income and number of rooms occupled. Revenue $ 1,425 1,445 1,439 1,348 1,450 1,431 1,446 1,485 1,405 1,461 1,490 1,426 Revenue $ 1,452 Occupied 31 Day occupied Day 1 72 14 15 51 1,361 1,426 1,470 1,456 1,430 1,354 1,442 1,394 1,459 1,399 1,458 1,537 2 20 3. 21 16 62 4. 25 17 45 70 18 41 23 19 62 20 20 47 39 21 43 15 22 38 10 50 23 36 11 41 24 60 12 35 25 65 13 41 PpictureClick here for the Excel Data File a. Choose the scatter diagram that best fits the data. Scatter diagram 1 scatter diagram 2 Scatter diagram 3 Scatterplot of Income vs Oecupled Scatterplot of Inceme vs Occupied Scatterplot of Income vs Occupied 1540 1540 1540 1440 1440 1440 1340 140 1340 20 40 se ce 29 50 20 Occupied Occopied Occupled O scatter dlagram 1 O scatter dlagram 2 O Scatter diagram 3 b. Determine the coefficlent of correlation between the two varlables. (Round your answer to 3 decimal places.) Pearson correlation
Glencoe Algebra 1, Student Edition, 9780079039897, 0079039898, 2018
18th Edition
ISBN:9780079039897
Author:Carter
Publisher:Carter
Chapter10: Statistics
Section10.6: Summarizing Categorical Data
Problem 10CYU
Related questions
Question
100%

Transcribed Image Text:A suburban hotel derives Its revenue from Its hotel and restaurant operations. The owners are Interested in the relationship between
the number of rooms occupled on a nightly basis and the revenue per day in the restaurant. Following is a sample of 25 days (Monday
through Thursday) from last year showing the restaurant Income and number of rooms occupled.
Revenue
$ 1,425
Day
Revenue
occupied
Day
occupied
$ 1,452
1,361
1,426
1,470
1,456
1,430
1,354
1,442
1,394
1,459
1,399
1,458
1,537
1
72
14
31
1,445
1,439
1,348
1,450
1,431
1,446
1,485
1,405
1,461
1,490
1,426
20
15
51
21
16
62
4.
25
17
45
70
18
41
23
19
62
7
20
20
47
39
21
43
15
22
38
10
50
23
36
11
41
24
60
12
35
25
65
13
41
EpictureClick here for the Excel Data File
a. Choose the scatter dlagram that best fits the data.
scatter diagram 1
Scatter diagram 2
Scatter diagram 3
Scatterplot of Income vs Occupied
Scatterplot of Income vs Occupied
Scatterplot of Income vs Occupled
1540
1540
1540
1440
1440
1440
1340
1340
20
239
30
40
50
20
20
40
Occupied
Occupled
Occupied
O scatter dlagram 1
O scatter dlagram 2
O Scatter diagram 3
b. Determine the coefficlent of correlation between the two varlables. (Round your answer to 3 decimal places.)
Pearson correlation

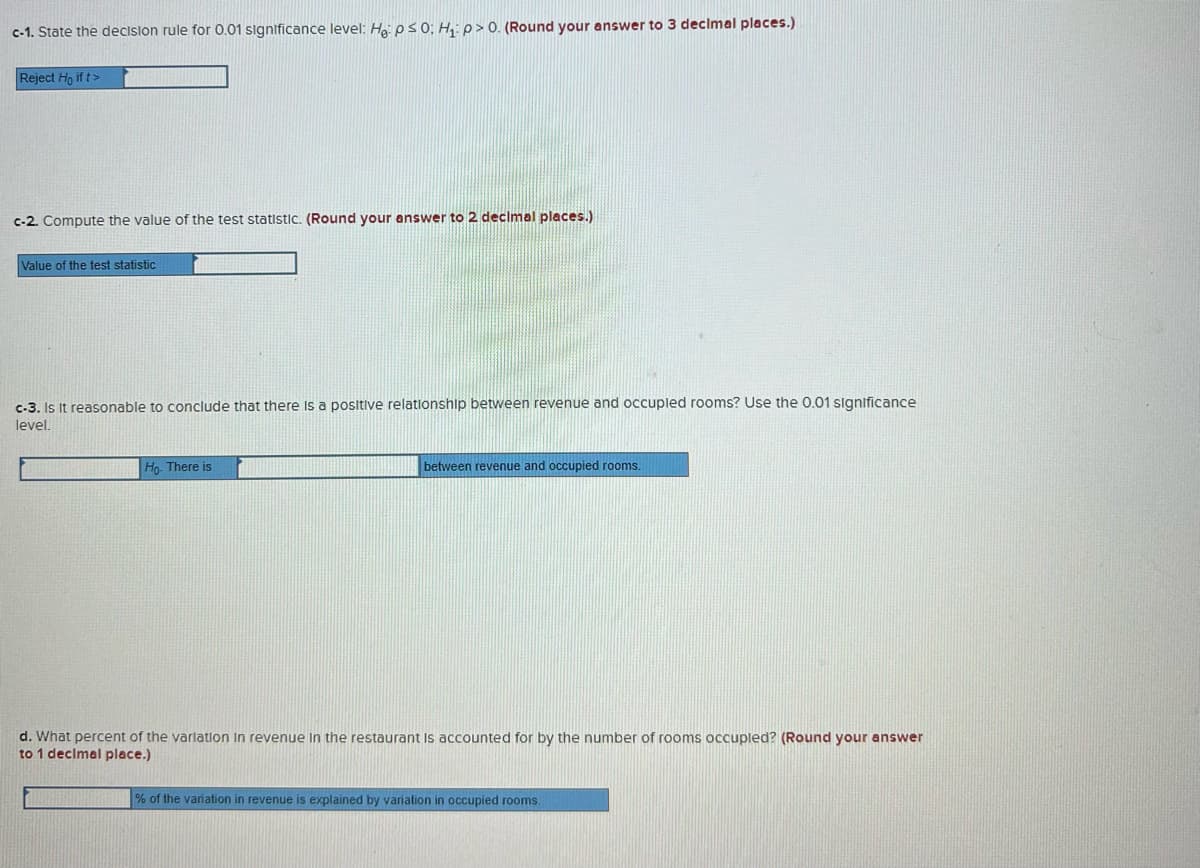
Transcribed Image Text:c-1. State the decislon rule for 0.01 significance level: Ha: ps 0; H: p>0. (Round your answer to 3 decimal places.)
Reject Ho if t>
c-2. Compute the value of the test statistic. (Round your answer to 2 decimal places.)
Value of the test statistic
c-3. Is It reasonable to conclude that there Is a positive relationship between revenue and occupled rooms? Use the 0.01 significance
level.
Ho. There is
between revenue and occupied rooms.
d. What percent of the varlation In revenue in the restaurant Is accounted for by the number of rooms occupled? (Round your answer
to 1 declmal place.)
% of the variation in revenue is explained by variation in occupied rooms.
Expert Solution
This question has been solved!
Explore an expertly crafted, step-by-step solution for a thorough understanding of key concepts.
This is a popular solution!
Trending now
This is a popular solution!
Step by step
Solved in 2 steps with 1 images

Recommended textbooks for you

Glencoe Algebra 1, Student Edition, 9780079039897…
Algebra
ISBN:
9780079039897
Author:
Carter
Publisher:
McGraw Hill

Holt Mcdougal Larson Pre-algebra: Student Edition…
Algebra
ISBN:
9780547587776
Author:
HOLT MCDOUGAL
Publisher:
HOLT MCDOUGAL

College Algebra (MindTap Course List)
Algebra
ISBN:
9781305652231
Author:
R. David Gustafson, Jeff Hughes
Publisher:
Cengage Learning

Glencoe Algebra 1, Student Edition, 9780079039897…
Algebra
ISBN:
9780079039897
Author:
Carter
Publisher:
McGraw Hill

Holt Mcdougal Larson Pre-algebra: Student Edition…
Algebra
ISBN:
9780547587776
Author:
HOLT MCDOUGAL
Publisher:
HOLT MCDOUGAL

College Algebra (MindTap Course List)
Algebra
ISBN:
9781305652231
Author:
R. David Gustafson, Jeff Hughes
Publisher:
Cengage Learning