A survey conducted by the American Automobile Association showed that a family of four spends an average of $215.50 per day while on vacation. Suppose a sample of 64 families of four vacationing at Niagara Falls resulted in a sample mean of $25 ber day and a sample standard deviation of $72.50. (a) Develop a 95% confidence interval estimate of the mean amount spent per day in dollars by a family of four visiting Niagara Falls. (Round your answers to the nearest cent.) to $ (b) Based on the confidence interval from part (a), does it appear that the population mean amount spent per day by families visiting Niagara Falls differs from the mean reported by the American Automobile Association? Explain.
A survey conducted by the American Automobile Association showed that a family of four spends an average of $215.50 per day while on vacation. Suppose a sample of 64 families of four vacationing at Niagara Falls resulted in a sample mean of $25 ber day and a sample standard deviation of $72.50. (a) Develop a 95% confidence interval estimate of the mean amount spent per day in dollars by a family of four visiting Niagara Falls. (Round your answers to the nearest cent.) to $ (b) Based on the confidence interval from part (a), does it appear that the population mean amount spent per day by families visiting Niagara Falls differs from the mean reported by the American Automobile Association? Explain.

MATLAB: An Introduction with Applications
6th Edition
ISBN:9781119256830
Author:Amos Gilat
Publisher:Amos Gilat
Chapter1: Starting With Matlab
Section: Chapter Questions
Problem 1P

Related questions
Question
Q4
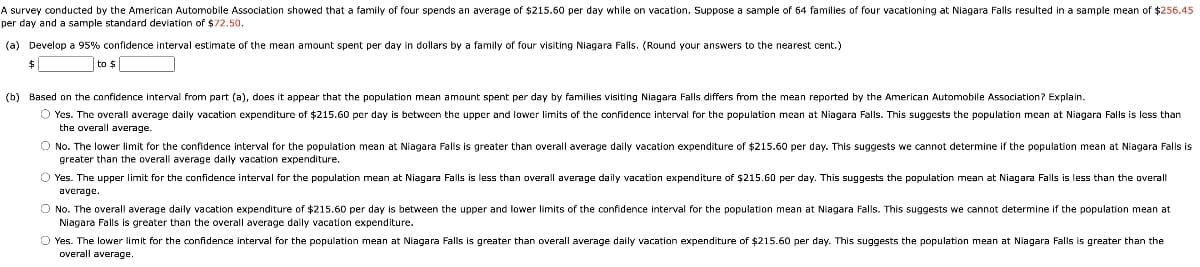
Transcribed Image Text:A survey conducted by the American Automobile Association showed that a family of four spends an average of $215.50 per day while on vacation. Suppose a sample of 64 families of four vacationing
per day and a sample standard deviation of $72.50.
Niagara Falls resulted in a sample mean of $256.45
(a) Develop
95% confidence interval estimate of the mean amount spent per day in dollars by a family of four visiting Niagara Falls. (Round your answers to the nearest cent.)
$
to $
(b) Based on the confidence interval from part (a), does it appear that the population mean amount spent per day by families visiting Niagara Falls differs from the mean reported by
American Automobile Association? Explain.
O Yes. The overall average daily vacation expenditure of $215.60 per day is between the upper and lower limits of the confidence interval for the population mean at Niagara Falls. This suggests the population mean at Niagara Falls is less than
the overall average.
O No. The lower limit for the confidence interval for the population mean
greater than the overall average daily vacation expenditure.
Niagara Falls is greater than overall average daily vacation expenditure of $215.60 per day. This suggests we cannot determine if the population mean at Niagara Falls is
O Yes. The upper limit for the confidence interval for the population mean at Niagara Falls is less than overall average daily vacation expenditure of $215.60 per day. This suggests the population mean at Niagara Falls is less than the overall
average.
O No. The overall average daily vacation expenditure of $215.60 per day is between the upper and lower limits of the confidence interval for the population mean at Niagara Falls. This suggests we cannot determine if the population mean at
Niagara Falls is greater than the overall average daily vacation expenditure.
O Yes. The lower limit for the confidence interval for the population mean at Niagara Falls is greater than overall average daily vacation expenditure of $215.60 per day. This suggests the population mean at Niagara Falls is greater than the
overall average.
Expert Solution
This question has been solved!
Explore an expertly crafted, step-by-step solution for a thorough understanding of key concepts.

This is a popular solution!

Trending now
This is a popular solution!

Step by step
Solved in 3 steps

Recommended textbooks for you
MATLAB: An Introduction with Applications
Statistics
ISBN:
9781119256830
Author:
Amos Gilat
Publisher:
John Wiley & Sons Inc

Probability and Statistics for Engineering and th…
Statistics
ISBN:
9781305251809
Author:
Jay L. Devore
Publisher:
Cengage Learning

Statistics for The Behavioral Sciences (MindTap C…
Statistics
ISBN:
9781305504912
Author:
Frederick J Gravetter, Larry B. Wallnau
Publisher:
Cengage Learning
MATLAB: An Introduction with Applications
Statistics
ISBN:
9781119256830
Author:
Amos Gilat
Publisher:
John Wiley & Sons Inc
Probability and Statistics for Engineering and th…
Statistics
ISBN:
9781305251809
Author:
Jay L. Devore
Publisher:
Cengage Learning
Statistics for The Behavioral Sciences (MindTap C…
Statistics
ISBN:
9781305504912
Author:
Frederick J Gravetter, Larry B. Wallnau
Publisher:
Cengage Learning

Elementary Statistics: Picturing the World (7th E…
Statistics
ISBN:
9780134683416
Author:
Ron Larson, Betsy Farber
Publisher:
PEARSON

The Basic Practice of Statistics
Statistics
ISBN:
9781319042578
Author:
David S. Moore, William I. Notz, Michael A. Fligner
Publisher:
W. H. Freeman

Introduction to the Practice of Statistics
Statistics
ISBN:
9781319013387
Author:
David S. Moore, George P. McCabe, Bruce A. Craig
Publisher:
W. H. Freeman