A team of researchers in the 1960s was interested in whether cigarette smoking sales could be used to predict the incident of bladder cancer deaths across populations. They surveyed 15 major cities in the United States and gathered data on how many cigarettes were sold per capita (i.e., number of cigarettes per person living in the city) and the number of bladder cancer deaths per 100,000 people. The data are below. Cigarette Sales: 18.2, 25.82, 18.24, 28.60, 31.1, 33.6, 40.46, 28.27, 20.1, 27.91, 26.18, 22.12, 21.84, 23.44, 21.58 Bladder Cancer Deaths: 2.9, 3.52, 2.99, 4.46, 5.11, 4.78, 5.6, 4.46, 3.08, 4.75, 4.09, 4.23, 2.91, 2.86, 4.65 a) What are the null and alternative hypotheses for this study? What statistical test should be used for this study? Justify your answer. b) What are the explanatory and response variables in this study? Justify your answer. c) What percent of the variability in the response variable is explained by


Contingency Table
A contingency table can be defined as the visual representation of the relationship between two or more categorical variables that can be evaluated and registered. It is a categorical version of the scatterplot, which is used to investigate the linear relationship between two variables. A contingency table is indeed a type of frequency distribution table that displays two variables at the same time.
Binomial Distribution
Binomial is an algebraic expression of the sum or the difference of two terms. Before knowing about binomial distribution, we must know about the binomial theorem.
5. A team of researchers in the 1960s was interested in whether cigarette smoking sales could be used to predict the incident of bladder cancer deaths across populations. They surveyed 15 major cities in the United States and gathered data on how many cigarettes were sold per capita (i.e., number of cigarettes per person living in the city) and the number of bladder cancer deaths per 100,000 people. The data are below.
Cigarette Sales: 18.2, 25.82, 18.24, 28.60, 31.1, 33.6, 40.46, 28.27, 20.1, 27.91, 26.18, 22.12, 21.84, 23.44, 21.58
Bladder Cancer Deaths: 2.9, 3.52, 2.99, 4.46, 5.11, 4.78, 5.6, 4.46, 3.08, 4.75, 4.09, 4.23, 2.91, 2.86, 4.65
a) What are the null and alternative hypotheses for this study? What statistical test should be used for this study? Justify your answer.
b) What are the explanatory and response variables in this study? Justify your answer.
c) What percent of the variability in the response variable is explained by the explanatory variable? Is the relationship between the two variables significant or not?
d) Let’s say a new city was surveyed and the number of cigarette sales per capita there was 22.81. How many bladder cancer deaths (per 100,000 people) would the researchers expect? What if cigarette sales were 38.81?
Hello! As you have posted more than 3 sub parts, we are answering the first 3 sub-parts. In case you require the unanswered parts also, kindly re-post that parts separately.
a)
Null Hypothesis:
H0: There is no significant relationship between cigarette sales and Bladder cancer.
Alternative Hypothesis:
H0: There is a significant relationship between cigarette sales and Bladder cancer.
In the given situation, A team of researchers in the 1960s was interested in whether cigarette smoking sales could be used to predict the incident of bladder cancer deaths across populations.
Hence, we can test the slope of the regression line by using t test,
b)
In the given situation, the Bladder cancer deaths are measured based on the cigarette smoking sales.
Hence, the independent variable is cigarette sales and the dependent variable is Bladder cancer deaths.
c)
Excel Procedure:
- Enter Cigarette sales and Bladder cancer deaths data in Excel
- Go to Data
- Click on Data Analysis> ‘Regression’.
- Select Bladder cancer deaths under ‘Input Y Range’.
- Select Cigarette sales under ‘Input X Range’.
- Click on ‘OK’.
Output:
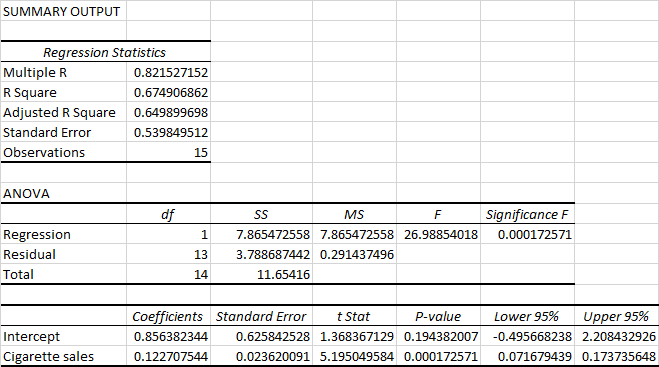
Form the output, the value of R square is 0.6749.
Thus, the percent of the variability in the response variable is explained by the explanatory variable is 67.49%.

Trending now
This is a popular solution!

Step by step
Solved in 3 steps with 1 images


