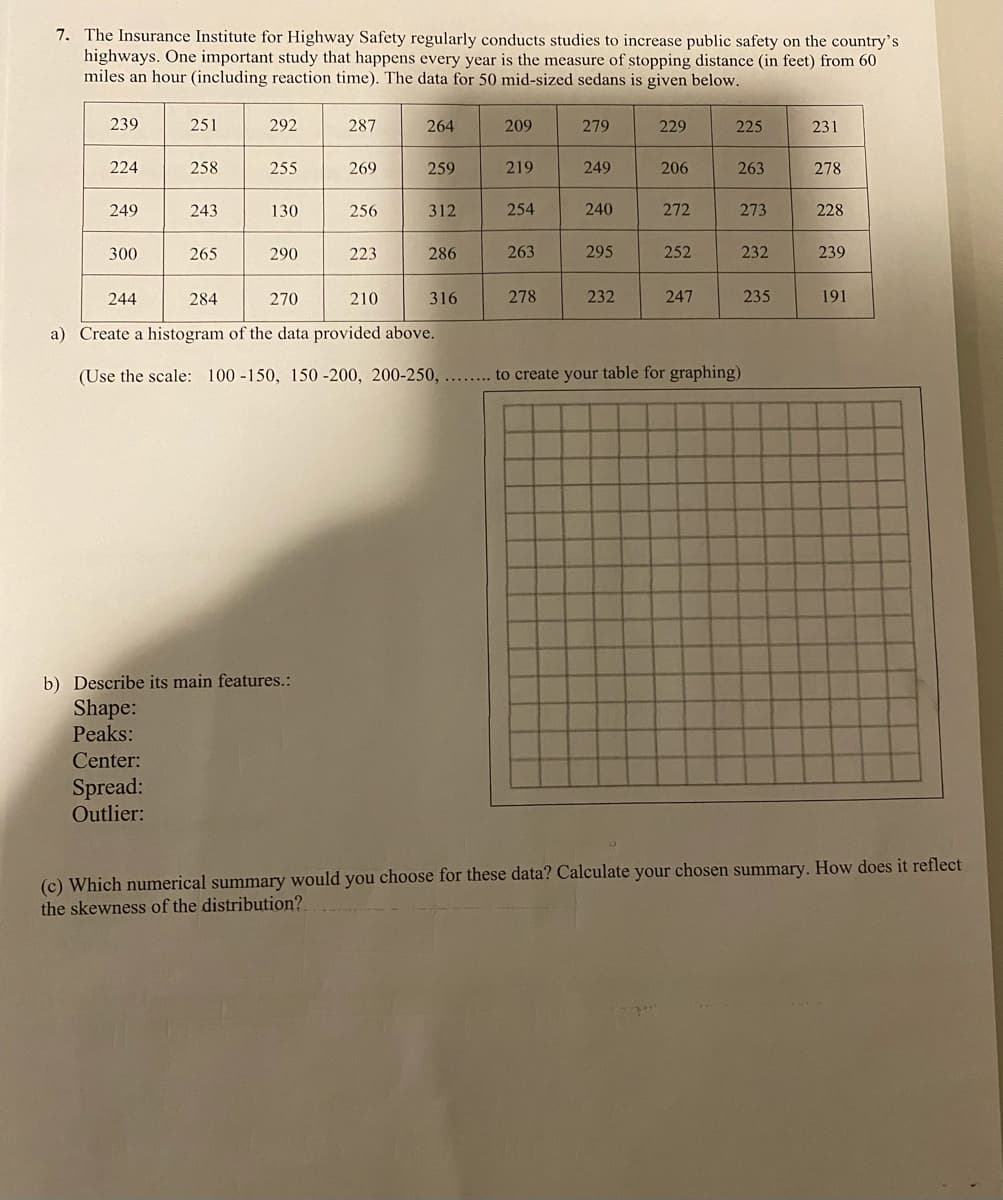
7. The Insurance Institute for Highway Safety regularly conducts studies to increase public safety on the country's highways. One important study that happens every year is the measure of stopping distance (in feet) from 60 miles an hour (including reaction time). The data for 50 mid-sized sedans is given below. 239 251 292 287 264 209 279 229 225 231 224 258 255 269 259 219 249 206 263 278 249 243 130 256 312 254 240 272 273 228 300 265 290 223 286 263 295 252 232 239 244 284 270 210 316 278 232 247 235 191 a) Create a histogram of the data provided above.
7. The Insurance Institute for Highway Safety regularly conducts studies to increase public safety on the country's highways. One important study that happens every year is the measure of stopping distance (in feet) from 60 miles an hour (including reaction time). The data for 50 mid-sized sedans is given below. 239 251 292 287 264 209 279 229 225 231 224 258 255 269 259 219 249 206 263 278 249 243 130 256 312 254 240 272 273 228 300 265 290 223 286 263 295 252 232 239 244 284 270 210 316 278 232 247 235 191 a) Create a histogram of the data provided above.
Glencoe Algebra 1, Student Edition, 9780079039897, 0079039898, 2018
18th Edition
ISBN:9780079039897
Author:Carter
Publisher:Carter
Chapter10: Statistics
Section10.4: Distributions Of Data
Problem 19PFA
Related questions
Question

Transcribed Image Text:7. The Insurance Institute for Highway Safety regularly conducts studies to increase public safety on the country's
highways. One important study that happens every year is the measure of stopping distance (in feet) from 60
miles an hour (including reaction time). The data for 50 mid-sized sedans is given below.
239
251
292
287
264
209
279
229
225
231
224
258
255
269
259
219
249
206
263
278
249
243
130
256
312
254
240
272
273
228
300
265
290
223
286
263
295
252
232
239
244
284
270
210
316
278
232
247
235
191
a) Create a histogram of the data provided above.
(Use the scale: 100 -150, 150 -200, 200-250, ....
to create your table for graphing)
b) Describe its main features.:
Shape:
Peaks:
Center:
Spread:
Outlier:
(c) Which numerical summary would you choose for these data? Calculate your chosen summary. How does it reflect
the skewness of the distribution?
Expert Solution
This question has been solved!
Explore an expertly crafted, step-by-step solution for a thorough understanding of key concepts.
This is a popular solution!
Trending now
This is a popular solution!
Step by step
Solved in 2 steps with 1 images

Recommended textbooks for you

Glencoe Algebra 1, Student Edition, 9780079039897…
Algebra
ISBN:
9780079039897
Author:
Carter
Publisher:
McGraw Hill

Big Ideas Math A Bridge To Success Algebra 1: Stu…
Algebra
ISBN:
9781680331141
Author:
HOUGHTON MIFFLIN HARCOURT
Publisher:
Houghton Mifflin Harcourt

Glencoe Algebra 1, Student Edition, 9780079039897…
Algebra
ISBN:
9780079039897
Author:
Carter
Publisher:
McGraw Hill

Big Ideas Math A Bridge To Success Algebra 1: Stu…
Algebra
ISBN:
9781680331141
Author:
HOUGHTON MIFFLIN HARCOURT
Publisher:
Houghton Mifflin Harcourt