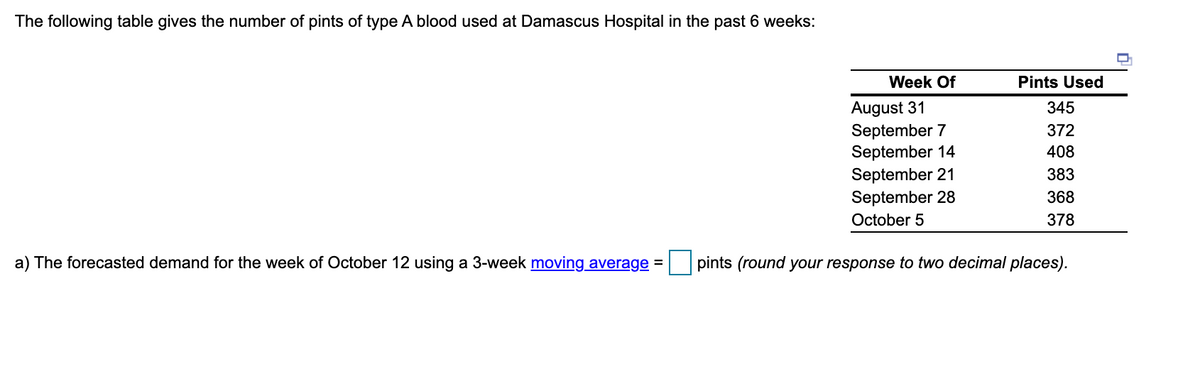
a) The forecasted demand for the week of October 12 using a 3-week moving average = pints (round your response to two decimal places).


Q: The following table contains the number of complaints received in the department store for first 6…
A: Moving average The moving average takes a moving window of actual values and forecasts for the next…
Q: When creating a time series–based forecast for the amount of soda to be sold in thecafeteria next…
A: Step 1: When creating a time series–based forecast for the amount of soda to be sold in thecafeteria…
Q: b) The forecast for the next month (Jan) using the naive method = sales (round your response to a…
A: Below is the solution:-
Q: three-period moving average. A weighted average using weights of .50 (most recent), .20 and .30.…
A: forecasting is a method which helps to predict the unknown future based on the known past…
Q: Explain what benefits as a forecasting tool does exponential smoothing have over moving averages?
A: In today's environment, when events change frequently, the exponential smoothing method is superior.…
Q: a) Using exponential smoothing and given a, the forecast for the month of July =million checks…
A: Below is the solution
Q: a. Using a three-week moving average, what would you forecast the next week to be number.) Forecast…
A: Forecasting is predicting in advance what future sales/demand can be.
Q: 5-15 Develop a 4-month moving average forecast for Wallace Garden Supply, and compute the MAD. A…
A:
Q: Given a 3-quarter period of actual and forecast demand as shown in the table. The company ABC sets a…
A: A forecasting method is a managerial tool which help to predict the unknown future based on…
Q: (a) Compute a weighted average forecast for the data listed below using a weight of 0.40 for the…
A:
Q: a. Use POM for Windows' least squares-linear regression module to develop a relationship to forecast…
A: The algebraic formulation of the regression lines is the Regression Equation. It's used to forecast…
Q: Complete the "Forecast for tomorrow" column in the table above. Use an exponential smoothing…
A:
Q: Given the following history, use a three-quarter moving average to forecast the demand for the third…
A: Given data is
Q: b) What is this year's forecast using a three-year weighted moving average with weights of 0.5, 0.3,…
A: The concept of Operation Management: Operation management is the management that applies to a…
Q: What is a time series and the rationale for forecasting based on a time series analysis?
A: Forecasting refers to the prediction of the future based on some evidence or a strong base.…
Q: Three months ago Two months ago Last month 400 units 350 units 320 units a. Using a simple…
A: Exponential smoothing is a forecast method based on time series with focus on uni-variate data.…
Q: Khyber Teaching Hospital is considering the purchase of a new ambulance. The decision will rest…
A: Given that: Year Mileage 1 4000 2 5000 3 4400 4 4800 5 4700
Q: Passenger miles flown on Northeast Airlines, a commuter firm serving the Boston hub, are shown for…
A: Find the given details below: Given details: Week Actual Passenger Miles(in 1000) 1 17 2 21…
Q: The operations manager using a combination of methods has forecast sales of Lomi Cup Orders at the…
A: Given data is
Q: (Round your answers to 2 decimal places.) Complete the table above, filling in the "Forecast for…
A: Forecast refers to the estimation of the future happening according to the previous and current data…
Q: 3. You are using a 3 period moving average to calculate your forecast. Demand for period 1 was 90…
A: Given information:Demand period 1=90unitsDemand period 2=80unitsDemand period4=90unitsHere we have…
Q: Do you think that hard rock cafe makes use of time horizons when forecasting explain with 3 points.
A: The three types of forecasting time horizons are, 1. Long range forecasting: A long range…
Q: (4) Exponential smoothing with a smoothing constant equal to 0.15, assuming a March forecast of…
A: Given data-
Q: Given the following historical data, what is the moving-average forecast for period 6 based on the…
A: Determine the moving-average forecast for Period 6 based on the last three period:
Q: How does the number of periods in a moving average affect the responsiveness of the forecast?
A: A moving average forecast method takes into account instead of the last actual data, a number of…
Q: Several business periodicals often carry reports of companies that may not have met their sales and…
A: Periodicals are a category of serial publications with a series of articles. They are published…
Q: How can the Forecast technique be improved?
A: Forecasting is a tool or technique which is used to predict future demand, risk and to analyze the…
Q: Using exponential smoothing with a weight of 0.6 on actual values: (a) If sales are $45,000 and…
A: Serial No Years Actual sales(At) Forecast sales(Ft) F1 2017 45000 - F2 2018 50000 45000 F3…
Q: What forecasting technique makes use of written surveys or telephone interviews?
A: Ans- Forecasting is the process of making assumptions of the future on the basis of past and present…
Q: Develop a forecast of enrolment beginning 2014 to 2021 using 3-years moving average forecast…
A: Forecasting is a technique that helps the business to predict the unknown future using the known…
Q: Selecting from MAD, MAPD, MSE, E, and , which measure of forecast accuracy do you consider superior?…
A: Forecast accuracy can be defined ad the deviation or the difference between the actual demand and…
Q: A retail store records customer demand during each sales period. The data has been collected in the…
A: given,
Q: Forecasting Historical records show the past ten Hood Lacrosse games having the following…
A: Forecasting is the process of prediction in which sales demand is estimated using historic…
Q: The Carbondale Hospital is considering the purchase of a new ambulance. The decision will rest…
A: Demand forecasting is nothing but the approach of making predictions or estimations about the demand…
Q: The monthly demand for units manufactured by the Acme Rocket Company has been as follows: a. Use the…
A: Given data is The initial forecast for May = 105 units Alpha(here a) = 0.2
Q: c) The forecast for year 6 using a weighted 2-year moving average with weights of 0.35 and 0.65 (the…
A: Forecasting is the process of prediction in which sales demand is estimated using historic…
Q: b) If the check-processing center received 45 million checks in the month of July, then using…
A: Forecasting is the process of predicting the future demand or sales of customers based on previous…
Q: A) Forecast the number of kilometers for years 3-6 using an exponential smoothing method (a = 0.1).…
A: Below is the solution
Q: What factors would you consider in deciding whether to use wide or narrow control limits for…
A: Control limits are the boundaries defined in a control chart within which all the random errors that…
Q: MSE
A: 3 period moving average = First month + Second month + Third month 3
Q: You have quarterly training data on beer production From 2006 to the end of 2007. Use the average…
A: Forecasting is a technique used to predict future outcomes on the basis of past data. In businesses…
Q: The Handy-Dandy Department Store had forecast sales of $110,000 for the previous week. The actual…
A: At=αDt+ 1-αAt-1=0.1130,000+1-0.1110,000=13,000+99,000=112,000 Hence, the forecast for the week is…
Q: Apply the following forecasting techniques of the data to estimate the demand in period 13: a.…
A: In the question, There are time-series data, actual demand data are given over the past 12 quarters.…
Q: Using a numerical example, demonstrate to Mr. John how he can use the manual trend projection method…
A: The trend projection method is a classical forecasting method, concerned with variable movement…
Q: While monitoring the forecast values in last 5 months, the tracking signals are consistently coming…
A: The tracking signal is given the ratio of accumulated forecast error to average error, with 0 being…
Q: 9. For a specific model of a shoe brand, Carrefour (NIZWA) experienced a sales of 1000 units, 1100…
A: Formulas used: Weighted moving average = ∑widi where w is the weight. d is the actual demand/sales i…
Q: Discuss what is seasonality and how forecast is done using data that has seasonality?
A: Time series analysis describes seasonal patterns as recurrent upward and downward cyclic patterns in…


Trending now
This is a popular solution!

Step by step
Solved in 2 steps with 1 images


- The Baker Company wants to develop a budget to predict how overhead costs vary with activity levels. Management is trying to decide whether direct labor hours (DLH) or units produced is the better measure of activity for the firm. Monthly data for the preceding 24 months appear in the file P13_40.xlsx. Use regression analysis to determine which measure, DLH or Units (or both), should be used for the budget. How would the regression equation be used to obtain the budget for the firms overhead costs?The owner of a restaurant in Bloomington, Indiana, has recorded sales data for the past 19 years. He has also recorded data on potentially relevant variables. The data are listed in the file P13_17.xlsx. a. Estimate a simple regression equation involving annual sales (the dependent variable) and the size of the population residing within 10 miles of the restaurant (the explanatory variable). Interpret R-square for this regression. b. Add another explanatory variableannual advertising expendituresto the regression equation in part a. Estimate and interpret this expanded equation. How does the R-square value for this multiple regression equation compare to that of the simple regression equation estimated in part a? Explain any difference between the two R-square values. How can you use the adjusted R-squares for a comparison of the two equations? c. Add one more explanatory variable to the multiple regression equation estimated in part b. In particular, estimate and interpret the coefficients of a multiple regression equation that includes the previous years advertising expenditure. How does the inclusion of this third explanatory variable affect the R-square, compared to the corresponding values for the equation of part b? Explain any changes in this value. What does the adjusted R-square for the new equation tell you?The file P13_42.xlsx contains monthly data on consumer revolving credit (in millions of dollars) through credit unions. a. Use these data to forecast consumer revolving credit through credit unions for the next 12 months. Do it in two ways. First, fit an exponential trend to the series. Second, use Holts method with optimized smoothing constants. b. Which of these two methods appears to provide the best forecasts? Answer by comparing their MAPE values.
- The file P13_29.xlsx contains monthly time series data for total U.S. retail sales of building materials (which includes retail sales of building materials, hardware and garden supply stores, and mobile home dealers). a. Is seasonality present in these data? If so, characterize the seasonality pattern. b. Use Winters method to forecast this series with smoothing constants = = 0.1 and = 0.3. Does the forecast series seem to track the seasonal pattern well? What are your forecasts for the next 12 months?The file P13_26.xlsx contains the monthly number of airline tickets sold by the CareFree Travel Agency. a. Create a time series chart of the data. Based on what you see, which of the exponential smoothing models do you think will provide the best forecasting model? Why? b. Use simple exponential smoothing to forecast these data, using a smoothing constant of 0.1. c. Repeat part b, but search for the smoothing constant that makes RMSE as small as possible. Does it make much of an improvement over the model in part b?The file P13_28.xlsx contains monthly retail sales of U.S. liquor stores. a. Is seasonality present in these data? If so, characterize the seasonality pattern. b. Use Winters method to forecast this series with smoothing constants = = 0.1 and = 0.3. Does the forecast series seem to track the seasonal pattern well? What are your forecasts for the next 12 months?
- The file P13_02.xlsx contains five years of monthly data on sales (number of units sold) for a particular company. The company suspects that except for random noise, its sales are growing by a constant percentage each month and will continue to do so for at least the near future. a. Explain briefly whether the plot of the series visually supports the companys suspicion. b. By what percentage are sales increasing each month? c. What is the MAPE for the forecast model in part b? In words, what does it measure? Considering its magnitude, does the model seem to be doing a good job? d. In words, how does the model make forecasts for future months? Specifically, given the forecast value for the last month in the data set, what simple arithmetic could you use to obtain forecasts for the next few months?The file P13_22.xlsx contains total monthly U.S. retail sales data. While holding out the final six months of observations for validation purposes, use the method of moving averages with a carefully chosen span to forecast U.S. retail sales in the next year. Comment on the performance of your model. What makes this time series more challenging to forecast?A small computer chip manufacturer wants to forecast monthly ozperating costs as a function of the number of units produced during a month. The company has collected the 16 months of data in the file P13_34.xlsx. a. Determine an equation that can be used to predict monthly production costs from units produced. Are there any outliers? b. How could the regression line obtained in part a be used to determine whether the company was efficient or inefficient during any particular month?
- The management of a technology company is trying to determine the variable that best explains the variation of employee salaries using a sample of 52 full-time employees; see the file P13_08.xlsx. Estimate simple linear regression equations to identify which of the following has the strongest linear relationship with annual salary: the employees gender, age, number of years of relevant work experience prior to employment at the company, number of years of employment at the company, or number of years of post secondary education. Provide support for your conclusion.Suppose that a regional express delivery service company wants to estimate the cost of shipping a package (Y) as a function of cargo type, where cargo type includes the following possibilities: fragile, semifragile, and durable. Costs for 15 randomly chosen packages of approximately the same weight and same distance shipped, but of different cargo types, are provided in the file P13_16.xlsx. a. Estimate a regression equation using the given sample data, and interpret the estimated regression coefficients. b. According to the estimated regression equation, which cargo type is the most costly to ship? Which cargo type is the least costly to ship? c. How well does the estimated equation fit the given sample data? How might the fit be improved? d. Given the estimated regression equation, predict the cost of shipping a package with semifragile cargo.The file P13_25.xlsx contains the quarterly numbers of applications for home mortgage loans at a branch office of Northern Central Bank. a. Create a time series chart of the data. Based on what you see, which of the exponential smoothing models do you think will provide the best forecasting model? Why? b. Use simple exponential smoothing to forecast these data, using a smoothing constant of 0.1. c. Repeat part b, but search for the smoothing constant that makes RMSE as small as possible. Does it make much of an improvement over the model in part b? Is it guaranteed to produce better forecasts for the future?

