A travel agent vigorously promotes cruises to Alaska for several months. The table shows the total (cumulative) sales every 3 weeks since the beginning of the special promotion. Cumulative Sales of Cruise Tickets Sales to Date (tickets) Week 74 4. 198 521 10 1251 13 2442 16 3660 19 4434 22 4751 25 4922 (0) Find function for the logistic model for cumulative sales, where x is the number of weeks, with data from 1sxS 25. (Round all numerical values to three decimal plad Sx) = Why is a logistic model appropriate to model these data? O The data reflect a continual inccrease and a change in concavity, which suggests a logistic model. O The data are concave down with a relative maximum, which suggests a logistic model, O The data are increasing with a constant rate of change, which su9gests a logistic model, O The data show a relative maximum and a relative minimum with changes in concavity, which suggests a logistic model. O The data are concave up with a relative minimum, which suggests a logistic model. (b) Calculate the percentage increase in the number of tickets sold between weeks 1 and 16 and between weeks I and 25. (Round your answers to one decimal place.) between weeks1 and 16 between weeks 1 and 25 Need Help? Read
A travel agent vigorously promotes cruises to Alaska for several months. The table shows the total (cumulative) sales every 3 weeks since the beginning of the special promotion. Cumulative Sales of Cruise Tickets Sales to Date (tickets) Week 74 4. 198 521 10 1251 13 2442 16 3660 19 4434 22 4751 25 4922 (0) Find function for the logistic model for cumulative sales, where x is the number of weeks, with data from 1sxS 25. (Round all numerical values to three decimal plad Sx) = Why is a logistic model appropriate to model these data? O The data reflect a continual inccrease and a change in concavity, which suggests a logistic model. O The data are concave down with a relative maximum, which suggests a logistic model, O The data are increasing with a constant rate of change, which su9gests a logistic model, O The data show a relative maximum and a relative minimum with changes in concavity, which suggests a logistic model. O The data are concave up with a relative minimum, which suggests a logistic model. (b) Calculate the percentage increase in the number of tickets sold between weeks 1 and 16 and between weeks I and 25. (Round your answers to one decimal place.) between weeks1 and 16 between weeks 1 and 25 Need Help? Read

Functions and Change: A Modeling Approach to College Algebra (MindTap Course List)
6th Edition
ISBN:9781337111348
Author:Bruce Crauder, Benny Evans, Alan Noell
Publisher:Bruce Crauder, Benny Evans, Alan Noell
Chapter5: A Survey Of Other Common Functions
Section5.1: Logistic Functions
Problem 17E: World Population The following table shows world population N, in billions, in the given year. Year...

Related questions
Question
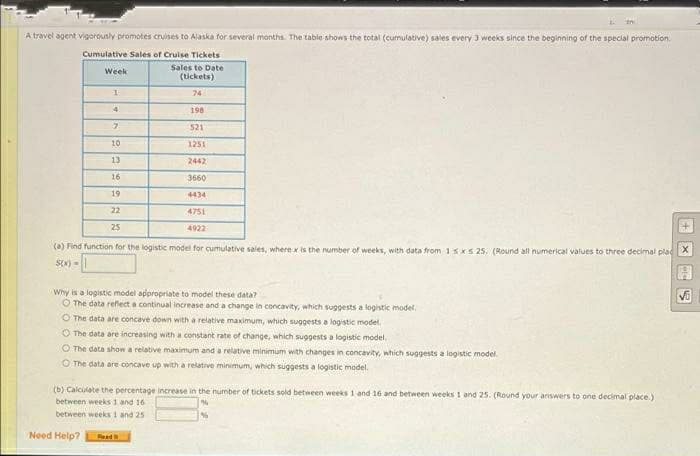
Transcribed Image Text:A travel agent vigorously promotes cruises to Alaska for several months. The table shows the total (cumulative) sales every 3 weeks since the beginning of the special promotion.
Cumulative Sales of Cruise Tickets
Sales to Date
(tickets)
Week
74
4.
198
521
10
1251
13
2442
16
3660
19
4434
22
4751
25
4922
(a) Find function for the logistic model for cumulative sales, where x is the number of weeks, with data from 15X5 25. (Round all numerical values to three decimal plad X
Why is a logistic model appropriate to model these data?
O The data reflect a continual inccrease and a change in concavity, which suggests a logistic model.
O The data are concave down with a relative maximum, which suggests a logistic model.
O The data are increasing with a constant rate of change, which su9gests a logistic model,
O The data show a relative maximum and a relative minimum with changes in concavity, which suggests a logistic model.
O The data are concave up with a relative minimum, which suggests a logistic madel.
(b) Calculate the percentage increase in the number of tickets sold between weeks 1 and 16 and between weeks 1 and 25. (Round your answers to one decimal place.)
between weeks 1 and 16
between weeks 1 and 25
Need Help?
Read
Expert Solution
This question has been solved!
Explore an expertly crafted, step-by-step solution for a thorough understanding of key concepts.

This is a popular solution!

Trending now
This is a popular solution!

Step by step
Solved in 3 steps with 13 images

Recommended textbooks for you
Functions and Change: A Modeling Approach to Coll…
Algebra
ISBN:
9781337111348
Author:
Bruce Crauder, Benny Evans, Alan Noell
Publisher:
Cengage Learning

College Algebra (MindTap Course List)
Algebra
ISBN:
9781305652231
Author:
R. David Gustafson, Jeff Hughes
Publisher:
Cengage Learning

Functions and Change: A Modeling Approach to Coll…
Algebra
ISBN:
9781337111348
Author:
Bruce Crauder, Benny Evans, Alan Noell
Publisher:
Cengage Learning
College Algebra (MindTap Course List)
Algebra
ISBN:
9781305652231
Author:
R. David Gustafson, Jeff Hughes
Publisher:
Cengage Learning

Linear Algebra: A Modern Introduction
Algebra
ISBN:
9781285463247
Author:
David Poole
Publisher:
Cengage Learning

Algebra & Trigonometry with Analytic Geometry
Algebra
ISBN:
9781133382119
Author:
Swokowski
Publisher:
Cengage