(a) Use class intervals of $0 to <$3, $3 to <$6, $6 to <$9, etc., to create a relative frequency distribution for these data. (Round your answers for relative frequency to four decimal places.) Class Interval Frequency Relative Frequency $0 - <$3 $3-<$6 $6-<$9 $9-<$12 $12-<$15 $15 - <$18 $18-<$21 TOTAL (b) Construct a histogram. Frequency 14 12 10 8 Frequency 14 12 10 3 4 51 0.0588 0.0784 0.0588 6 9 12 15 18 21 3 6 9 12 15 18 21 Cost Cost Frequency 14 12 10 8 Frequency 15 10 5 H 6 9 12 15 18 18 21 3 6 9 12 15 18 21 Comment on its shape. O This is a unimodal distribution with a peak at the 0-3 class. The distribution is positively skewed. Cost Cost O This is a bimodal distribution with peaks at the 12-15 and 18-21 classes. The distribution is negatively skewed. O This is a bimodal distribution with peaks at the 0-3 and 6-9 classes. The distribution is positively skewed. O This is a unimodal distribution with a peak at the 9-12 class. The distribution is reasonably symmetric. (c) Using the relative frequency distribution or the histogram, estimate the proportion of the states that have a minimum monthly cost of less than $12.00 a month. (Round your answer to one decimal place.)
(a) Use class intervals of $0 to <$3, $3 to <$6, $6 to <$9, etc., to create a relative frequency distribution for these data. (Round your answers for relative frequency to four decimal places.) Class Interval Frequency Relative Frequency $0 - <$3 $3-<$6 $6-<$9 $9-<$12 $12-<$15 $15 - <$18 $18-<$21 TOTAL (b) Construct a histogram. Frequency 14 12 10 8 Frequency 14 12 10 3 4 51 0.0588 0.0784 0.0588 6 9 12 15 18 21 3 6 9 12 15 18 21 Cost Cost Frequency 14 12 10 8 Frequency 15 10 5 H 6 9 12 15 18 18 21 3 6 9 12 15 18 21 Comment on its shape. O This is a unimodal distribution with a peak at the 0-3 class. The distribution is positively skewed. Cost Cost O This is a bimodal distribution with peaks at the 12-15 and 18-21 classes. The distribution is negatively skewed. O This is a bimodal distribution with peaks at the 0-3 and 6-9 classes. The distribution is positively skewed. O This is a unimodal distribution with a peak at the 9-12 class. The distribution is reasonably symmetric. (c) Using the relative frequency distribution or the histogram, estimate the proportion of the states that have a minimum monthly cost of less than $12.00 a month. (Round your answer to one decimal place.)

Glencoe Algebra 1, Student Edition, 9780079039897, 0079039898, 2018
18th Edition
ISBN:9780079039897
Author:Carter
Publisher:Carter
Chapter10: Statistics
Section10.6: Summarizing Categorical Data
Problem 35PPS

Related questions
Question
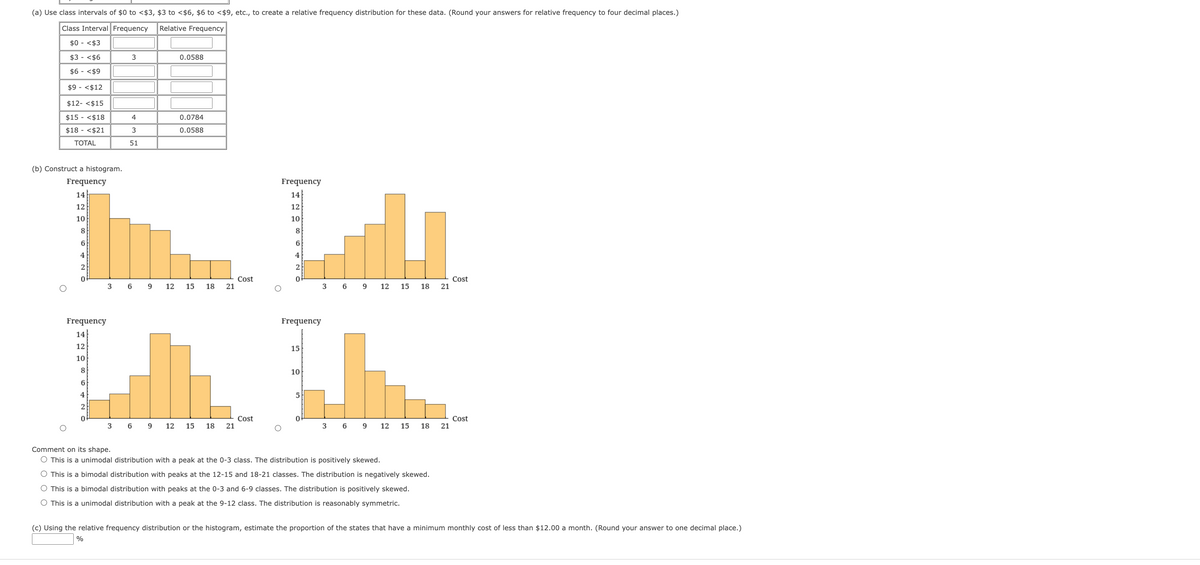
Transcribed Image Text:(a) Use class intervals of $0 to <$3, $3 to <$6, $6 to <$9, etc., to create a relative frequency distribution for these data. (Round your answers for relative frequency to four decimal places.)
Class Interval Frequency
Relative Frequency
$0 <$3
$3 <$6
$6 <$9
$9 <$12
$12- <$15
$15 <$18
$18 <$21
TOTAL
(b) Construct a histogram.
Frequency
14
12
10
8
6
4
Frequency
14
12
10
8
6
4
2
3
3
4
3
51
3 6 9 12 15 18 21
6
0.0588
9
0.0784
0.0588
12 15 18 21
Cost
Cost
Frequency
14
12
10
8
6
4
Frequency
15
10
5
3 6 9
3
6
9
12 15 18 21
12
15
18
Comment on its shape.
O This is a unimodal distribution with a peak at the 0-3 class. The distribution is positively skewed.
This is a bimodal distribution with peaks at the 12-15 and 18-21 classes. The distribution is negatively skewed.
O This is a bimodal distribution with peaks at the 0-3 and 6-9 classes. The distribution is positively skewed.
O This is a unimodal distribution with a peak at the 9-12 class. The distribution is reasonably symmetric.
21
Cost
Cost
(c) Using the relative frequency distribution or the histogram, estimate the proportion of the states that have a minimum monthly cost of less than $12.00 a month. (Round your answer to one decimal place.)
%
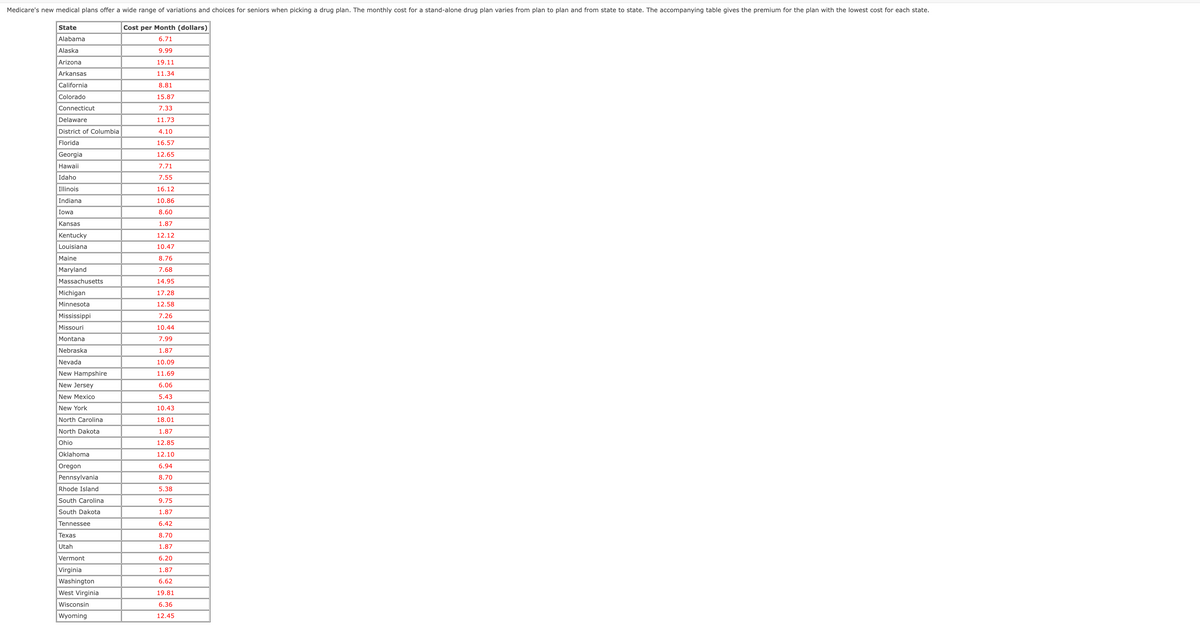
Transcribed Image Text:Medicare's new medical plans offer a wide range of variations and choices for seniors when picking a drug plan. The monthly cost for a stand-alone drug plan varies from plan to plan and from state to state. The accompanying table gives the premium for the plan with the lowest cost for each state.
Cost per Month (dollars)
6.71
9.99
19.11
11.34
8.81
15.87
7.33
11.73
4.10
16.57
12.65
7.71
7.55
16.12
10.86
8.60
1.87
12.12
10.47
8.76
7.68
14.95
17.28
12.58
7.26
10.44
7.99
1.87
10.09
11.69
6.06
State
Alabama
Alaska
Arizona
Arkansas
California
Colorado
Connecticut
Delaware
District of Columbia
Florida
Georgia
Hawaii
Idaho
Illinois
Indiana
Iowa
Kansas
Kentucky
Louisiana
Maine
Maryland
Massachusetts
Michigan
Minnesota
Mississippi
Missouri
Montana
Nebraska
Nevada
New Hampshire
New Jersey
New Mexico
New York
North Carolina
North Dakota
Ohio
Oklahoma
Oregon
Pennsylvania
Rhode Island
South Carolina
South Dakota
Tennessee
Texas
Utah
Vermont
Virginia
Washington
West Virginia
Wisconsin
Wyoming
5.43
10.43
18.01
1.87
12.85
12.10
6.94
8.70
5.38
9.75
1.87
6.42
8.70
1.87
6.20
1.87
6.62
19.81
6.36
12.45
Expert Solution
This question has been solved!
Explore an expertly crafted, step-by-step solution for a thorough understanding of key concepts.

This is a popular solution!

Trending now
This is a popular solution!

Step by step
Solved in 2 steps with 1 images

Recommended textbooks for you
Glencoe Algebra 1, Student Edition, 9780079039897…
Algebra
ISBN:
9780079039897
Author:
Carter
Publisher:
McGraw Hill
Glencoe Algebra 1, Student Edition, 9780079039897…
Algebra
ISBN:
9780079039897
Author:
Carter
Publisher:
McGraw Hill