a) Use StatCrunch to find the correlation coefficient. r = {5 decimal places} b) Run the following hypothesis test to determine if the correlation is significant: Họ: p = 0 Hai p = 0 Use the P-value for the slope to determine if the correlation significant? Select an answer Explain the correlation: Select an answer
a) Use StatCrunch to find the correlation coefficient. r = {5 decimal places} b) Run the following hypothesis test to determine if the correlation is significant: Họ: p = 0 Hai p = 0 Use the P-value for the slope to determine if the correlation significant? Select an answer Explain the correlation: Select an answer

Glencoe Algebra 1, Student Edition, 9780079039897, 0079039898, 2018
18th Edition
ISBN:9780079039897
Author:Carter
Publisher:Carter
Chapter4: Equations Of Linear Functions
Section4.5: Correlation And Causation
Problem 2CYU

Related questions
Question
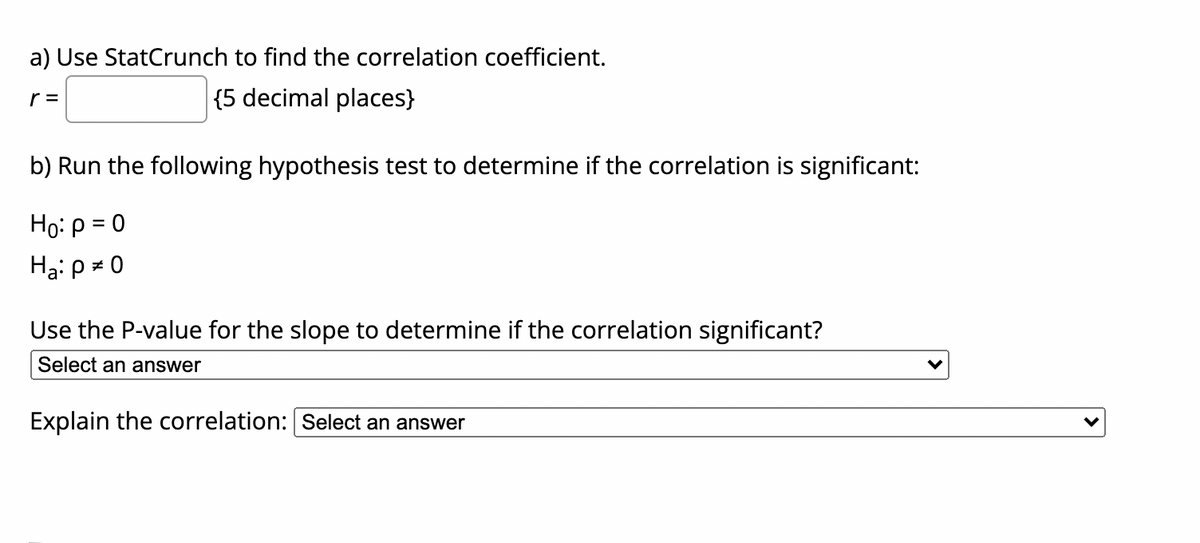
Transcribed Image Text:a) Use StatCrunch to find the correlation coefficient.
r =
{5 decimal places}
b) Run the following hypothesis test to determine if the correlation is significant:
Họ: p = 0
Ha: p = 0
Use the P-value for the slope to determine if the correlation significant?
Select an answer
Explain the correlation: Select an answer
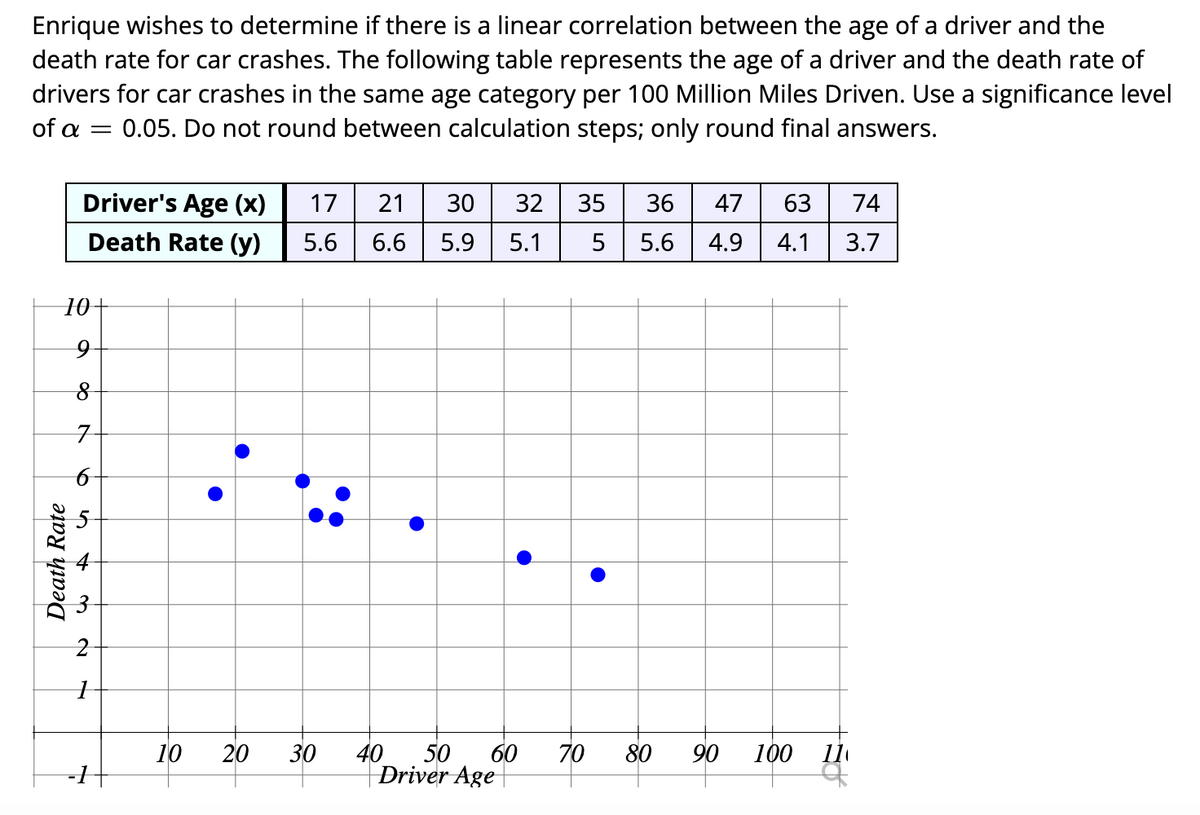
Transcribed Image Text:Enrique wishes to determine if there is a linear correlation between the age of a driver and the
death rate for car crashes. The following table represents the age of a driver and the death rate of
drivers for car crashes in the same age category per 100 Million Miles Driven. Use a significance level
of a = 0.05. Do not round between calculation steps; only round final answers.
Driver's Age (x)
17
21
30
32
35
36
47
63
74
Death Rate (y)
5.6
6.6
5.9
5.1
5
5.6
4.9
4.1
3.7
10
10
20
30
40
60
70
90
100
50
Driver Age
80
Death Rate
Expert Solution
This question has been solved!
Explore an expertly crafted, step-by-step solution for a thorough understanding of key concepts.

This is a popular solution!

Trending now
This is a popular solution!

Step by step
Solved in 3 steps with 2 images

Recommended textbooks for you
Glencoe Algebra 1, Student Edition, 9780079039897…
Algebra
ISBN:
9780079039897
Author:
Carter
Publisher:
McGraw Hill

Big Ideas Math A Bridge To Success Algebra 1: Stu…
Algebra
ISBN:
9781680331141
Author:
HOUGHTON MIFFLIN HARCOURT
Publisher:
Houghton Mifflin Harcourt
Glencoe Algebra 1, Student Edition, 9780079039897…
Algebra
ISBN:
9780079039897
Author:
Carter
Publisher:
McGraw Hill
Big Ideas Math A Bridge To Success Algebra 1: Stu…
Algebra
ISBN:
9781680331141
Author:
HOUGHTON MIFFLIN HARCOURT
Publisher:
Houghton Mifflin Harcourt