The Normal Distribution Activity For Data Set 2 Mean = 2.000 Variance = 4.5263 Standard Deviation = 2.1275 7. Sketch the second bell curve by showing the mean and standard deviation. 8. What is the data value (raw score) associated with a standard score of 2.08? Determine the percentage greater than this score. Draw the curve and show your complete solution. 2.0r. X- 1 A.cecson e vers 2.195 X. G. VIS2 2.00 The percentage that is greater than the raw score of 6.4252 is 98.12%. 9. What is the data value (raw score) associated with a standard score of -1.3? Determine the percentage less than this score. Draw the curve and show your complete solution. - .-1 Aze 1.3 - 0.5+ - voge -1-16st x - * 0.9032 10. 81 %, LES THAN EA coes - 1.3 0 The percentage that is less than the raw score of -0.7658 is 90.32%.
The Normal Distribution Activity For Data Set 2 Mean = 2.000 Variance = 4.5263 Standard Deviation = 2.1275 7. Sketch the second bell curve by showing the mean and standard deviation. 8. What is the data value (raw score) associated with a standard score of 2.08? Determine the percentage greater than this score. Draw the curve and show your complete solution. 2.0r. X- 1 A.cecson e vers 2.195 X. G. VIS2 2.00 The percentage that is greater than the raw score of 6.4252 is 98.12%. 9. What is the data value (raw score) associated with a standard score of -1.3? Determine the percentage less than this score. Draw the curve and show your complete solution. - .-1 Aze 1.3 - 0.5+ - voge -1-16st x - * 0.9032 10. 81 %, LES THAN EA coes - 1.3 0 The percentage that is less than the raw score of -0.7658 is 90.32%.

MATLAB: An Introduction with Applications
6th Edition
ISBN:9781119256830
Author:Amos Gilat
Publisher:Amos Gilat
Chapter1: Starting With Matlab
Section: Chapter Questions
Problem 1P

Related questions
Question
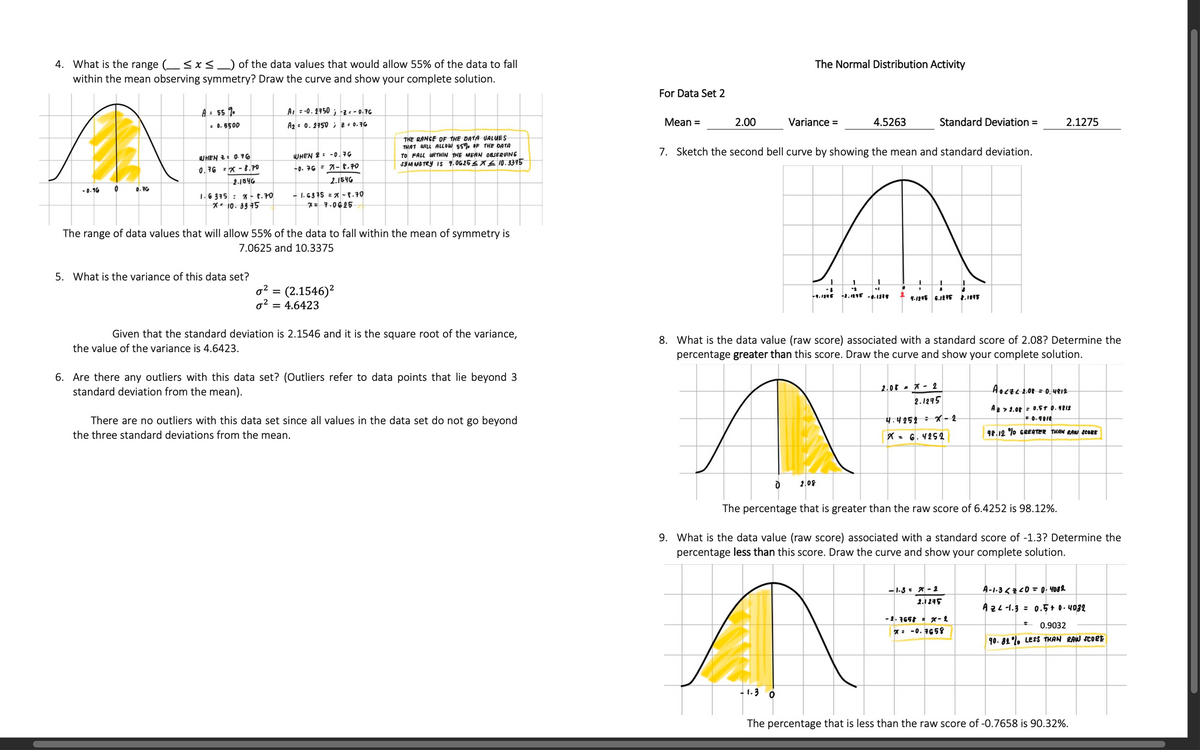
Transcribed Image Text:4. What is the range (sxs_) of the data values that would allow 55% of the data to fall
within the mean observing symmetry? Draw the curve and show your complete solution.
The Normal Distribution Activity
For Data Set 2
A. 4. 110 ;..16
A 0. 150 1G
..500
Mean =
2.000
Variance =
4.5263
Standard Deviation =
2.1275
THE RANGE OF THE DATA UALUES
7. Sketch the second bell curve by showing the mean and standard deviation.
UHEN -0,G
TO PALL n E MERN ORsrenNE
0.16 x-t.
. G A-t.t0
hart
1.6 315 : - t.10
** 10. 945
- 6SIS x-.10
11.0025
The range of data values that will allow 55% of the data to fall within the mean of symmetry is
7.0625 and 10.3375
5. What is the variance of this data set?
g? = (2.1546)?
g? = 4.6423
Given that the standard deviation is 2.1546 and it is the square root of the variance,
8. What is the data value (raw score) associated with a standard score of 2.08? Determine the
percentage greater than this score. Draw the curve and show your complete solution.
the value of the variance is 4.6423.
6. Are there any outliers with this data set? (Outliers refer to data points that lie beyond 3
standard deviation from the mean).
2.0r- X- 1
2.1215
Aocecior 0. vers
A1.0. .r .
There are no outliers with this data set since all values in the data set do not go beyond
the three standard deviations from the mean.
4.4151 X-
*. G. V252
r.12 o cereee T e eer
2.09
The percentage that is greater than the raw score of 6.4252 is 98.12%.
9. What is the data value (raw score) associated with a standard score of -1.3? Determine the
percentage less than this score. Draw the curve and show your complete solution.
-1.3.-1
2.1245
Aze -1.3 = 0.5+ D. v032
- 0.9032
*. -0. 165
90. 81, Lert HAN RAW SCoet
1.3 0
The percentage that is less than the raw score of -0.7658 is 90.32%.
Expert Solution
This question has been solved!
Explore an expertly crafted, step-by-step solution for a thorough understanding of key concepts.

This is a popular solution!

Trending now
This is a popular solution!

Step by step
Solved in 3 steps with 1 images

Follow-up Questions
Read through expert solutions to related follow-up questions below.
Follow-up Question
What is the
Solution
Recommended textbooks for you
MATLAB: An Introduction with Applications
Statistics
ISBN:
9781119256830
Author:
Amos Gilat
Publisher:
John Wiley & Sons Inc

Probability and Statistics for Engineering and th…
Statistics
ISBN:
9781305251809
Author:
Jay L. Devore
Publisher:
Cengage Learning

Statistics for The Behavioral Sciences (MindTap C…
Statistics
ISBN:
9781305504912
Author:
Frederick J Gravetter, Larry B. Wallnau
Publisher:
Cengage Learning
MATLAB: An Introduction with Applications
Statistics
ISBN:
9781119256830
Author:
Amos Gilat
Publisher:
John Wiley & Sons Inc
Probability and Statistics for Engineering and th…
Statistics
ISBN:
9781305251809
Author:
Jay L. Devore
Publisher:
Cengage Learning
Statistics for The Behavioral Sciences (MindTap C…
Statistics
ISBN:
9781305504912
Author:
Frederick J Gravetter, Larry B. Wallnau
Publisher:
Cengage Learning

Elementary Statistics: Picturing the World (7th E…
Statistics
ISBN:
9780134683416
Author:
Ron Larson, Betsy Farber
Publisher:
PEARSON

The Basic Practice of Statistics
Statistics
ISBN:
9781319042578
Author:
David S. Moore, William I. Notz, Michael A. Fligner
Publisher:
W. H. Freeman

Introduction to the Practice of Statistics
Statistics
ISBN:
9781319013387
Author:
David S. Moore, George P. McCabe, Bruce A. Craig
Publisher:
W. H. Freeman