eek (US $) () Consumption per week (US $) (Y) 55, 60, 65, 70, 75 65, 70, 74, 80, 85, 88, 79, 84, 90, 94, 98 80, 93, 95, 103, 108, 113, 115 102, 107, 110, 116, 118, 125 110, 115, 120, 130, 135, 140 120, 136, 140, 144, 145 135, 137, 140, 152, 157, 160, 162 137, 145, 155, 165, 175, 189 150, 152, 175, 178, 180, 185, 191 i, calculate the conditional expectation of Y: E(Y| Xi) cattergram, with income being X-axis, consumption bein (Y | Xi) on the above figure different representations of PRF and SRF. (1ik
eek (US $) () Consumption per week (US $) (Y) 55, 60, 65, 70, 75 65, 70, 74, 80, 85, 88, 79, 84, 90, 94, 98 80, 93, 95, 103, 108, 113, 115 102, 107, 110, 116, 118, 125 110, 115, 120, 130, 135, 140 120, 136, 140, 144, 145 135, 137, 140, 152, 157, 160, 162 137, 145, 155, 165, 175, 189 150, 152, 175, 178, 180, 185, 191 i, calculate the conditional expectation of Y: E(Y| Xi) cattergram, with income being X-axis, consumption bein (Y | Xi) on the above figure different representations of PRF and SRF. (1ik

Glencoe Algebra 1, Student Edition, 9780079039897, 0079039898, 2018
18th Edition
ISBN:9780079039897
Author:Carter
Publisher:Carter
Chapter10: Statistics
Section10.6: Summarizing Categorical Data
Problem 24PPS

Related questions
Question
Please help me with solutions to these questions.
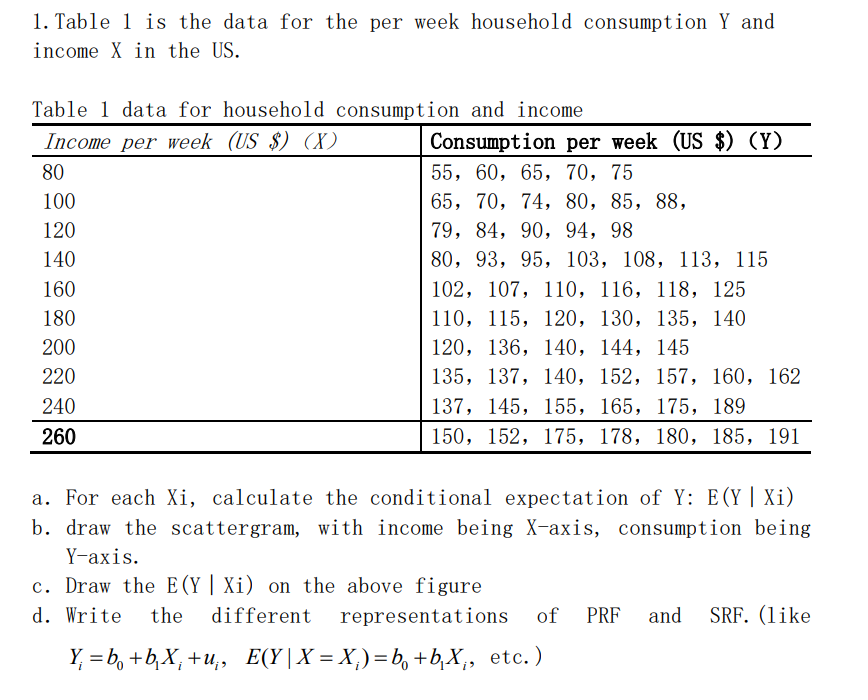
Transcribed Image Text:1. Table 1 is the data for the per week household consumption Y and
income X in the US.
Table 1 data for household consumption and income
Income per week (US $) (X)
Consumption per week (US $) (Y)
80
55, 60, 65, 70, 75
100
65, 70, 74, 80, 85, 88,
120
79, 84, 90, 94, 98
140
80, 93, 95, 103, 108, 113, 115
160
102, 107, 110, 116, 118, 125
180
110, 115, 120, 130, 135, 140
200
120, 136, 140, 144, 145
220
135, 137, 140, 152, 157, 160, 162
240
137, 145, 155, 165, 175, 189
260
150, 152, 175, 178, 180, 185, 191
a. For each Xi, calculate the conditional expectation of Y: E(Y| Xi)
b. draw the scattergram, with income being X-axis, consumption being
Ү-аxis.
c. Draw the E(Y| Xi) on the above figure
d. Write
the
different
representations
of
PRF
and
SRF. (like
Y, = b, +b,X, +u,, E(Y|X = X,)=b, +b,X,, etc.)
Expert Solution
This question has been solved!
Explore an expertly crafted, step-by-step solution for a thorough understanding of key concepts.

Step by step
Solved in 4 steps with 4 images

Recommended textbooks for you
Glencoe Algebra 1, Student Edition, 9780079039897…
Algebra
ISBN:
9780079039897
Author:
Carter
Publisher:
McGraw Hill

Linear Algebra: A Modern Introduction
Algebra
ISBN:
9781285463247
Author:
David Poole
Publisher:
Cengage Learning

Mathematics For Machine Technology
Advanced Math
ISBN:
9781337798310
Author:
Peterson, John.
Publisher:
Cengage Learning,
Glencoe Algebra 1, Student Edition, 9780079039897…
Algebra
ISBN:
9780079039897
Author:
Carter
Publisher:
McGraw Hill
Linear Algebra: A Modern Introduction
Algebra
ISBN:
9781285463247
Author:
David Poole
Publisher:
Cengage Learning
Mathematics For Machine Technology
Advanced Math
ISBN:
9781337798310
Author:
Peterson, John.
Publisher:
Cengage Learning,