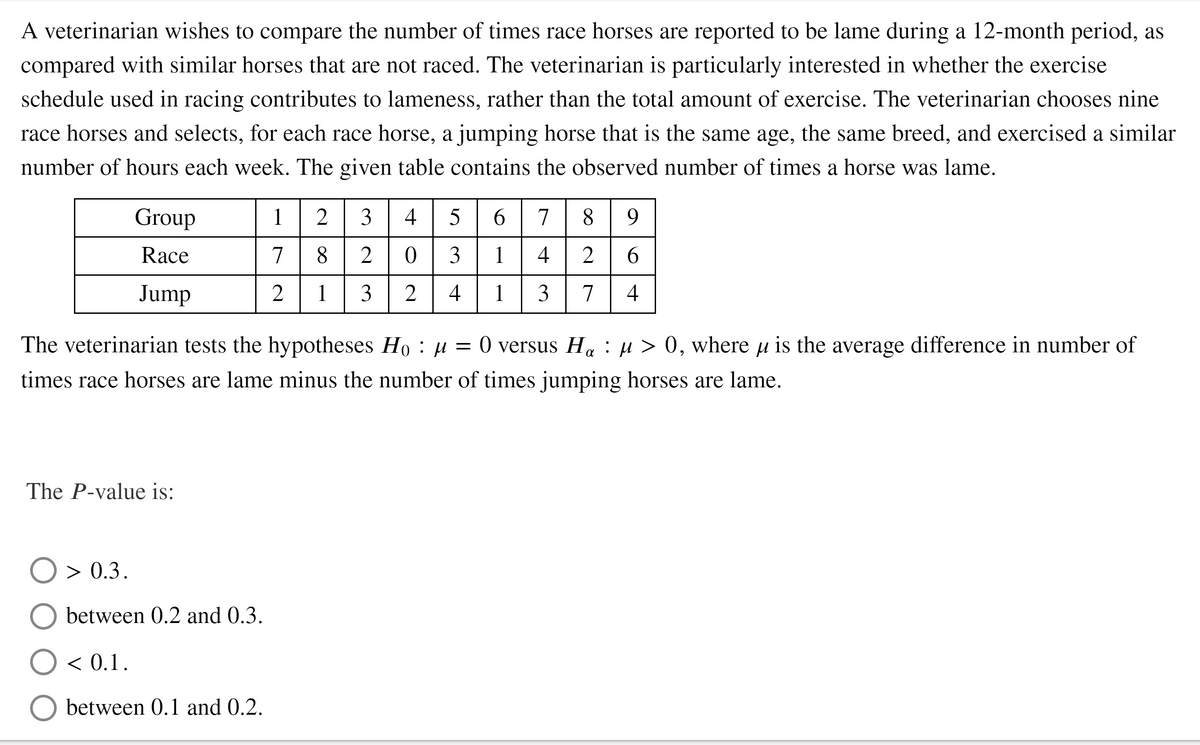
A veterinarian wishes to compare the number of times race horses are reported to be lame during a 12-month period, as compared with similar horses that are not raced. The veterinarian is particularly interested in whether the exercise chedule used in racing contributes to lameness, rather than the total amount of exercise. The veterinarian chooses nine ace horses and selects, for each race horse, a jumping horse that is the same age, the same breed, and exercised a simila umber of hours each week. The given table contains the observed number of times a horse was lame. Group 1 2 3 4 5 6 789 Race 7 8 2 3 1 4 2 6. Jump 1 3 2 4 1 3 7 4 The veterinarian tests the hypotheses Ho : µ = 0 versus H : µ > 0, where µu is the average difference in number of imes race horses are lame minus the number of times jumping horses are lame. The P-value is: O > 0.3. between 0.2 and 0.3. O < 0.1. O between 0.1 and 0.2.


Unitary Method
The word “unitary” comes from the word “unit”, which means a single and complete entity. In this method, we find the value of a unit product from the given number of products, and then we solve for the other number of products.
Speed, Time, and Distance
Imagine you and 3 of your friends are planning to go to the playground at 6 in the evening. Your house is one mile away from the playground and one of your friends named Jim must start at 5 pm to reach the playground by walk. The other two friends are 3 miles away.
Profit and Loss
The amount earned or lost on the sale of one or more items is referred to as the profit or loss on that item.
Units and Measurements
Measurements and comparisons are the foundation of science and engineering. We, therefore, need rules that tell us how things are measured and compared. For these measurements and comparisons, we perform certain experiments, and we will need the experiments to set up the devices.
Help!!


Trending now
This is a popular solution!

Step by step
Solved in 2 steps


