A "What-If" analysis: A department store sells two popular models of wireless headphones, model A and model B. The sales of these products are not independent of each other. Economists call these "substitutable products" because if the price of one increases, more people will choose to substitute the other product and sales of the other will increase. The electronics manager wants to calculate prices that maximize revenue from these two products. Price and sales data shows the following relationships between the quantity sold (N) and prices (P) of each model: NA 18-0.52 PA+ 0.32 PB Ng=33+0.18 PA-0.72 PB A spreadsheet for calculating the total revenue for various values of PA and PB is displayed below. It has been designed with the two prices as input parameters that are easily varied. Price A Price B 19 26 Number sold A -18-0.52 B1+0.32*B2 Number sold B -33+0.18 B1-0.72 B2 Total Revenue -B1 B3+B2 B4 Copy-and-paste, or type, the Excel information given above into cells A1:B5 of an Excel spreadsheet. Develop a two-way data table to estimate the optimal prices of each of the two products in order to maximize the total revenue. Vary the price of each product from 25 to 40 in increments of 1. Round the Total Revenue to two (2) decimal places. Optimal Price A = Revenue - A Optimal Price B A Total
A "What-If" analysis: A department store sells two popular models of wireless headphones, model A and model B. The sales of these products are not independent of each other. Economists call these "substitutable products" because if the price of one increases, more people will choose to substitute the other product and sales of the other will increase. The electronics manager wants to calculate prices that maximize revenue from these two products. Price and sales data shows the following relationships between the quantity sold (N) and prices (P) of each model: NA 18-0.52 PA+ 0.32 PB Ng=33+0.18 PA-0.72 PB A spreadsheet for calculating the total revenue for various values of PA and PB is displayed below. It has been designed with the two prices as input parameters that are easily varied. Price A Price B 19 26 Number sold A -18-0.52 B1+0.32*B2 Number sold B -33+0.18 B1-0.72 B2 Total Revenue -B1 B3+B2 B4 Copy-and-paste, or type, the Excel information given above into cells A1:B5 of an Excel spreadsheet. Develop a two-way data table to estimate the optimal prices of each of the two products in order to maximize the total revenue. Vary the price of each product from 25 to 40 in increments of 1. Round the Total Revenue to two (2) decimal places. Optimal Price A = Revenue - A Optimal Price B A Total

Practical Management Science
6th Edition
ISBN:9781337406659
Author:WINSTON, Wayne L.
Publisher:WINSTON, Wayne L.
Chapter2: Introduction To Spreadsheet Modeling
Section: Chapter Questions
Problem 20P: Julie James is opening a lemonade stand. She believes the fixed cost per week of running the stand...

Related questions
Question
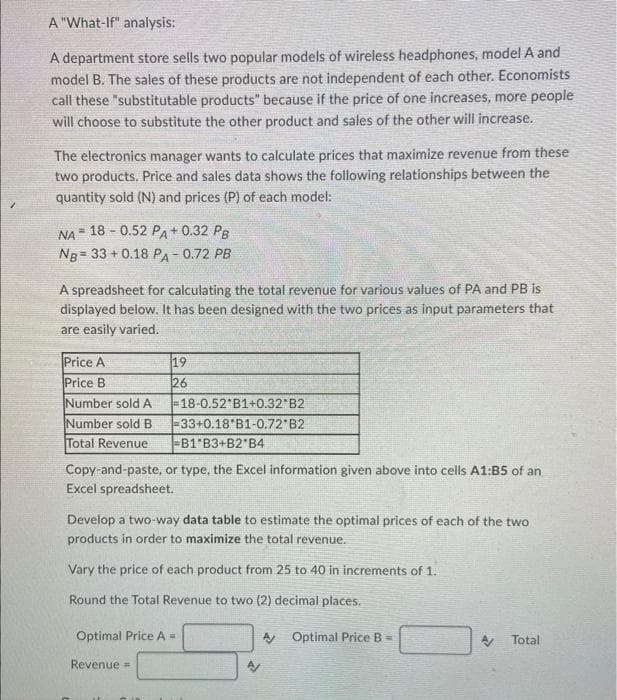
Transcribed Image Text:A "What-If" analysis:
A department store sells two popular models of wireless headphones, model A and
model B. The sales of these products are not independent of each other. Economists
call these "substitutable products" because if the price of one increases, more people
will choose to substitute the other product and sales of the other will increase.
The electronics manager wants to calculate prices that maximize revenue from these
two products. Price and sales data shows the following relationships between the
quantity sold (N) and prices (P) of each model:
NA =
18- 0.52 PA+ 0.32 PB
Ng= 33+0.18 PA-0.72 PB
A spreadsheet for calculating the total revenue for various values of PA and PB is
displayed below. It has been designed with the two prices as input parameters that
are easily varied.
Price A
Price B
19
26
Number sold A
-18-0.52 B1+0.32 B2
Number sold B
-33+0.18 B1-0.72 B2
Total Revenue
-B1 B3+B2 B4
Copy-and-paste, or type, the Excel information given above into cells A1:B5 of an
Excel spreadsheet.
Develop a two-way data table to estimate the optimal prices of each of the two
products in order to maximize the total revenue.
Vary the price of each product from 25 to 40 in increments of 1.
Round the Total Revenue to two (2) decimal places.
Optimal Price A =
Revenue =
A Optimal Price B
A Total
Expert Solution
This question has been solved!
Explore an expertly crafted, step-by-step solution for a thorough understanding of key concepts.

Step by step
Solved in 2 steps with 5 images

Recommended textbooks for you
Practical Management Science
Operations Management
ISBN:
9781337406659
Author:
WINSTON, Wayne L.
Publisher:
Cengage,

Operations Management
Operations Management
ISBN:
9781259667473
Author:
William J Stevenson
Publisher:
McGraw-Hill Education

Operations and Supply Chain Management (Mcgraw-hi…
Operations Management
ISBN:
9781259666100
Author:
F. Robert Jacobs, Richard B Chase
Publisher:
McGraw-Hill Education
Practical Management Science
Operations Management
ISBN:
9781337406659
Author:
WINSTON, Wayne L.
Publisher:
Cengage,
Operations Management
Operations Management
ISBN:
9781259667473
Author:
William J Stevenson
Publisher:
McGraw-Hill Education
Operations and Supply Chain Management (Mcgraw-hi…
Operations Management
ISBN:
9781259666100
Author:
F. Robert Jacobs, Richard B Chase
Publisher:
McGraw-Hill Education


Purchasing and Supply Chain Management
Operations Management
ISBN:
9781285869681
Author:
Robert M. Monczka, Robert B. Handfield, Larry C. Giunipero, James L. Patterson
Publisher:
Cengage Learning

Production and Operations Analysis, Seventh Editi…
Operations Management
ISBN:
9781478623069
Author:
Steven Nahmias, Tava Lennon Olsen
Publisher:
Waveland Press, Inc.