a. Calculate the SE for estimating the mean sugar content of cereals displayed on the lower shelves, using data only from the lower shelves (ignoring the other two samples), and explain what the number means. b. Calculate the same SE as above, except use data from all observations, not just the 20 from the lower shelves. Which SE is better? c. Can we conclude that on average cereals displayed on the middle shelves contain more than 2 gr/serving sugar compared to the cereals displayed on the lower shelves? Test at α = 0.05. Clearly define the parameters and the hypotheses, report the test statistic and p-value.
a. Calculate the SE for estimating the mean sugar content of cereals displayed on the lower shelves, using data only from the lower shelves (ignoring the other two samples), and explain what the number means. b. Calculate the same SE as above, except use data from all observations, not just the 20 from the lower shelves. Which SE is better? c. Can we conclude that on average cereals displayed on the middle shelves contain more than 2 gr/serving sugar compared to the cereals displayed on the lower shelves? Test at α = 0.05. Clearly define the parameters and the hypotheses, report the test statistic and p-value.

MATLAB: An Introduction with Applications
6th Edition
ISBN:9781119256830
Author:Amos Gilat
Publisher:Amos Gilat
Chapter1: Starting With Matlab
Section: Chapter Questions
Problem 1P

Related questions
Topic Video
Question
100%
a. Calculate the SE for estimating the
b. Calculate the same SE as above, except use data from all observations, not just the 20 from the lower shelves. Which SE is better?
c. Can we conclude that on average cereals displayed on the middle shelves contain more than 2 gr/serving sugar compared to the cereals displayed on the lower shelves? Test at α = 0.05. Clearly define the parameters and the hypotheses, report the test statistic and p-value.
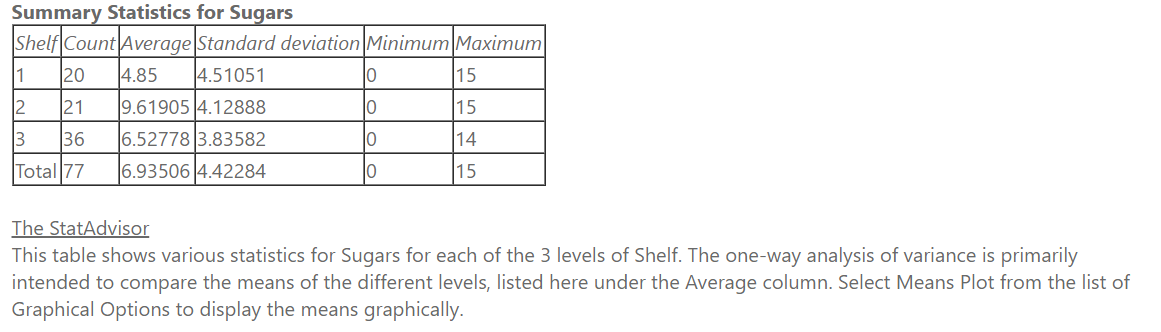
Transcribed Image Text:Summary Statistics for Sugars
Shelf Count Average Standard deviation Minimum Maximum
20
4.85
4.51051
15
2
21
9.61905 4.12888
15
13
36
6.52778 3.83582
14
Total 77
6.93506 4.42284
15
The StatAdvisor
This table shows various statistics for Sugars for each of the 3 levels of Shelf. The one-way analysis of variance is primarily
intended to compare the means of the different levels, listed here under the Average column. Select Means Plot from the list of
Graphical Options to display the means graphically.
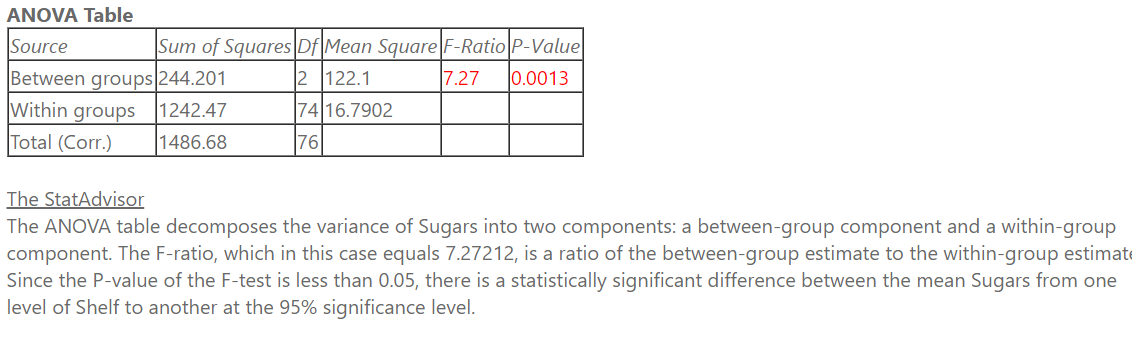
Transcribed Image Text:ANOVA Table
Source
Sum of Squares Df Mean Square F-Ratio P-Value
Between groups|244.201
2 122.1
7.27
0.0013
74 16.7902
Within groups 1242.47
Total (Corr.)
1486.68
76
The StatAdvisor
The ANOVA table decomposes the variance of Sugars into two components: a between-group component and a within-group
component. The F-ratio, which in this case equals 7.27212, is a ratio of the between-group estimate to the within-group estimate
Since the P-value of the F-test is less than 0.05, there is a statistically significant difference between the mean Sugars from one
level of Shelf to another at the 95% significance level.
Expert Solution
This question has been solved!
Explore an expertly crafted, step-by-step solution for a thorough understanding of key concepts.

Step by step
Solved in 4 steps with 1 images

Knowledge Booster


Learn more about
Need a deep-dive on the concept behind this application? Look no further. Learn more about this topic, statistics and related others by exploring similar questions and additional content below.Recommended textbooks for you
MATLAB: An Introduction with Applications
Statistics
ISBN:
9781119256830
Author:
Amos Gilat
Publisher:
John Wiley & Sons Inc

Probability and Statistics for Engineering and th…
Statistics
ISBN:
9781305251809
Author:
Jay L. Devore
Publisher:
Cengage Learning

Statistics for The Behavioral Sciences (MindTap C…
Statistics
ISBN:
9781305504912
Author:
Frederick J Gravetter, Larry B. Wallnau
Publisher:
Cengage Learning
MATLAB: An Introduction with Applications
Statistics
ISBN:
9781119256830
Author:
Amos Gilat
Publisher:
John Wiley & Sons Inc
Probability and Statistics for Engineering and th…
Statistics
ISBN:
9781305251809
Author:
Jay L. Devore
Publisher:
Cengage Learning
Statistics for The Behavioral Sciences (MindTap C…
Statistics
ISBN:
9781305504912
Author:
Frederick J Gravetter, Larry B. Wallnau
Publisher:
Cengage Learning

Elementary Statistics: Picturing the World (7th E…
Statistics
ISBN:
9780134683416
Author:
Ron Larson, Betsy Farber
Publisher:
PEARSON

The Basic Practice of Statistics
Statistics
ISBN:
9781319042578
Author:
David S. Moore, William I. Notz, Michael A. Fligner
Publisher:
W. H. Freeman

Introduction to the Practice of Statistics
Statistics
ISBN:
9781319013387
Author:
David S. Moore, George P. McCabe, Bruce A. Craig
Publisher:
W. H. Freeman