a. Construct a sorted stem and leaf diagram to compare the two sets of data and comment on the effects of the new fertilizer. b. Use numerical measures of descriptive statistics to describe both the data set. c. Explain and interpret the all 3 SD intervals for both the data set.
a. Construct a sorted stem and leaf diagram to compare the two sets of data and comment on the effects of the new fertilizer. b. Use numerical measures of descriptive statistics to describe both the data set. c. Explain and interpret the all 3 SD intervals for both the data set.

Chapter9: Sequences, Probability And Counting Theory
Section9.5: Counting Principles
Problem 5SE: Answer the following questions. 5. What is the term for the arrangement that selects r objects from...

Related questions
Topic Video
Question
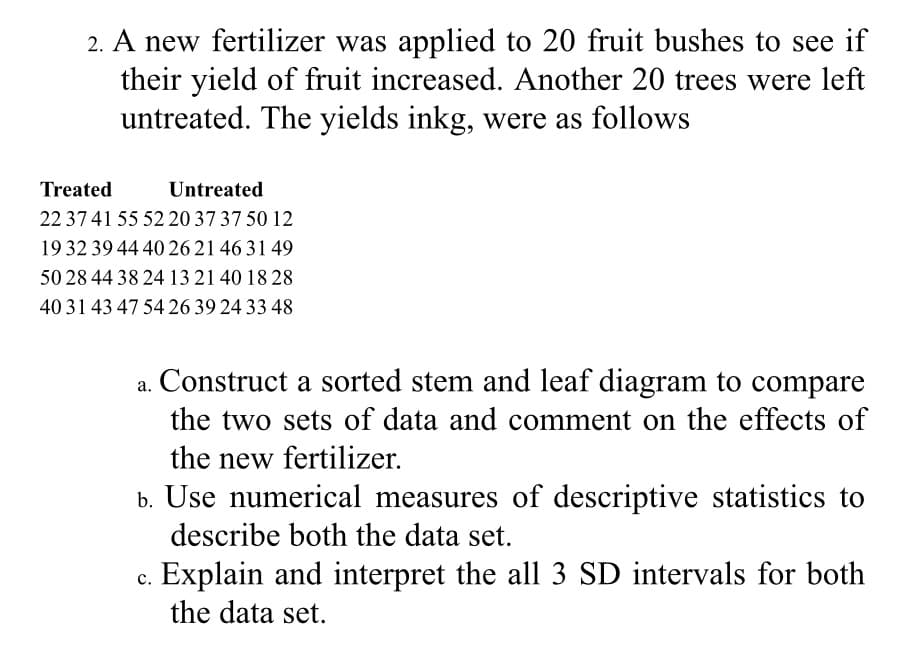
Transcribed Image Text:2. A new fertilizer was applied to 20 fruit bushes to see if
their yield of fruit increased. Another 20 trees were left
untreated. The yields inkg, were as follows
Treated
Untreated
22 37 41 55 52 20 37 37 50 12
19 32 39 44 40 26 21 46 31 49
50 28 44 38 24 13 21 40 18 28
40 31 43 47 54 26 39 24 33 48
a. Construct a sorted stem and leaf diagram to compare
the two sets of data and comment on the effects of
the new fertilizer.
b. Use numerical measures of descriptive statistics to
describe both the data set.
Explain and interpret the all 3 SD intervals for both
the data set.
Expert Solution
This question has been solved!
Explore an expertly crafted, step-by-step solution for a thorough understanding of key concepts.

Step by step
Solved in 4 steps with 6 images

Knowledge Booster


Learn more about
Need a deep-dive on the concept behind this application? Look no further. Learn more about this topic, statistics and related others by exploring similar questions and additional content below.Recommended textbooks for you

College Algebra (MindTap Course List)
Algebra
ISBN:
9781305652231
Author:
R. David Gustafson, Jeff Hughes
Publisher:
Cengage Learning
College Algebra (MindTap Course List)
Algebra
ISBN:
9781305652231
Author:
R. David Gustafson, Jeff Hughes
Publisher:
Cengage Learning