(a) Which class had the highest test score? (b) Which class had test scores with a larger interquartile range (IQR)? (c) Which class had a higher median test score?
(a) Which class had the highest test score? (b) Which class had test scores with a larger interquartile range (IQR)? (c) Which class had a higher median test score?

Algebra & Trigonometry with Analytic Geometry
13th Edition
ISBN:9781133382119
Author:Swokowski
Publisher:Swokowski
Chapter7: Analytic Trigonometry
Section7.6: The Inverse Trigonometric Functions
Problem 94E

Related questions
Question
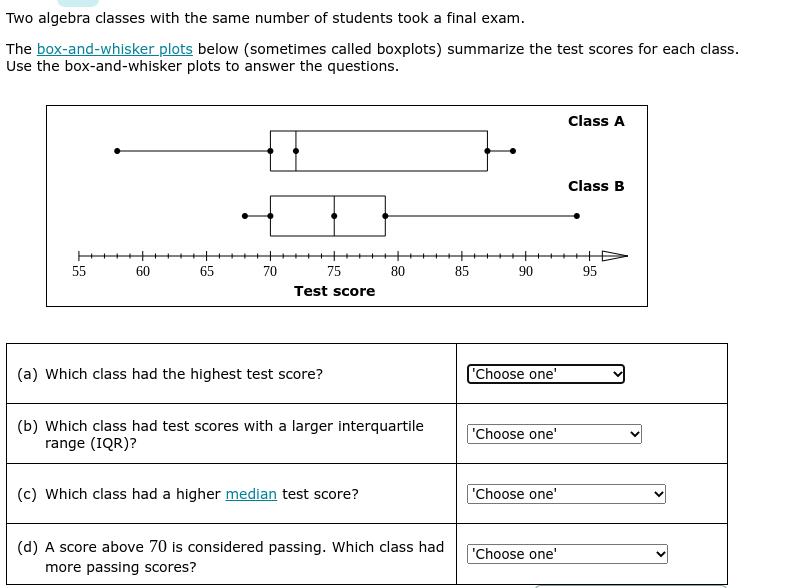
Transcribed Image Text:Two algebra classes with the same number of students took a final exam.
The box-and-whisker plots below (sometimes called boxplots) summarize the test scores for each class.
Use the box-and-whisker plots to answer the questions.
Class A
Class B
++D
95
55
60
65
70
75
80
85
90
Test score
(a) Which class had the highest test score?
'Choose one'
(b) Which class had test scores with a larger interquartile
range (IQR)?
"Choose one'
(c) Which class had a higher median test score?
'Choose one'
(d) A score above 70 is considered passing. Which class had
'Choose one'
more passing scores?
Expert Solution
This question has been solved!
Explore an expertly crafted, step-by-step solution for a thorough understanding of key concepts.

This is a popular solution!

Trending now
This is a popular solution!

Step by step
Solved in 4 steps with 4 images

Recommended textbooks for you
Algebra & Trigonometry with Analytic Geometry
Algebra
ISBN:
9781133382119
Author:
Swokowski
Publisher:
Cengage
Algebra & Trigonometry with Analytic Geometry
Algebra
ISBN:
9781133382119
Author:
Swokowski
Publisher:
Cengage