A. Construct a stem plot(show work) B. Construct a table that contains the frequency and relative frequency distribution for the data. The lower the limit class must be 120 and the class width 18(show all work)
A. Construct a stem plot(show work) B. Construct a table that contains the frequency and relative frequency distribution for the data. The lower the limit class must be 120 and the class width 18(show all work)

Glencoe Algebra 1, Student Edition, 9780079039897, 0079039898, 2018
18th Edition
ISBN:9780079039897
Author:Carter
Publisher:Carter
Chapter10: Statistics
Section10.6: Summarizing Categorical Data
Problem 23PPS

Related questions
Question
100%
A. Construct a stem plot(show work)
B. Construct a table that contains the frequency and relative frequency distribution for the data. The lower the limit class must be 120 and the class width 18(show all work)
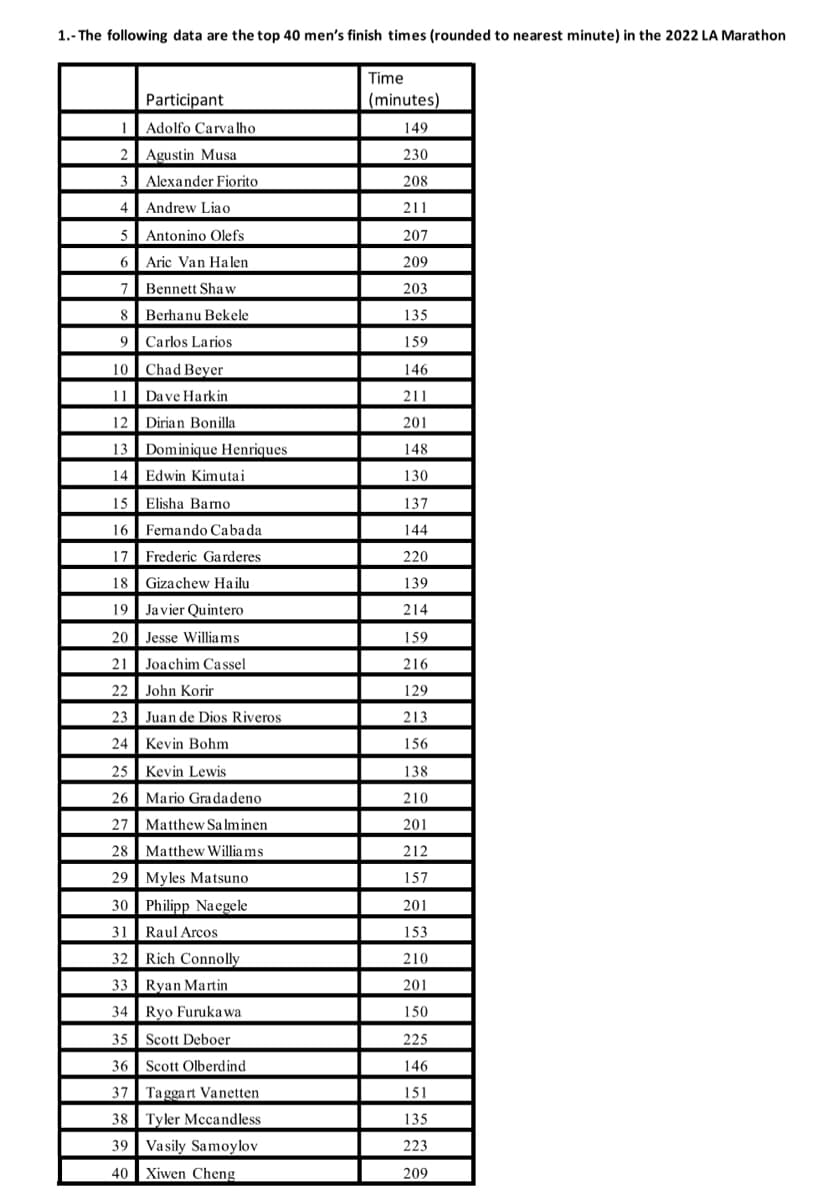
Transcribed Image Text:1.- The following data are the top 40 men's finish times (rounded to nearest minute) in the 2022 LA Marathon
Time
Participant
(minutes)
1 Adolfo Carva lho
149
2 Agustin Musa
230
3 Alexander Fiorito
208
4 Andrew Liao
211
5 Antonino Olefs
207
6 Aric Van Halen
209
7 Bennett Shaw
203
8 Berhanu Bekele
135
9| Carlos Larios
159
10 I Chad Bever
146
11 Dave Harkin
211
12 Dirian Bonilla
201
13 Dominique Henriques
148
14 Edwin Kimutai
130
15 | Elisha Barno
137
16 Fermando Cabada
144
17 Frederic Garderes
220
18 Gizachew Hailu
139
19 Javier Quintero
214
20 Jesse Williams
159
21 Joachim Cassel
216
22 John Korir
129
23 Juan de Dios Riveros
213
24 | Kevin Bohm
156
25 Kevin Lewis
138
26 Mario Gradadeno
210
27 Matthew Sa Iminen
201
28 Matthew Willia ms
212
29 Myles Matsuno
157
30 Philipp Naegele
201
31 | Raul Arcos
153
32 Rich Connolly
210
33 Ryan Martin
201
34 Ryo Furukawa
150
35 | Scott Deboer
225
36 Scott Olberdind
146
37 Taggart Vanetten
151
38 Tyler Mccandless
135
39 Vasily Samoylov
223
40 Xiwen Cheng
209
Expert Solution
This question has been solved!
Explore an expertly crafted, step-by-step solution for a thorough understanding of key concepts.

Step by step
Solved in 2 steps with 1 images

Recommended textbooks for you
Glencoe Algebra 1, Student Edition, 9780079039897…
Algebra
ISBN:
9780079039897
Author:
Carter
Publisher:
McGraw Hill
Glencoe Algebra 1, Student Edition, 9780079039897…
Algebra
ISBN:
9780079039897
Author:
Carter
Publisher:
McGraw Hill