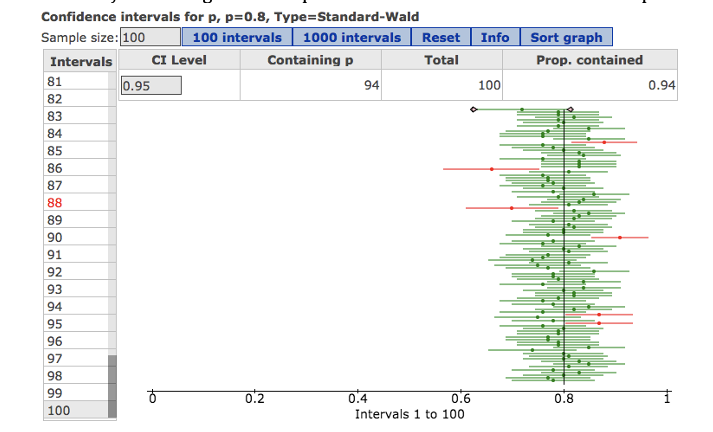
A student selected a random sample with a sample proportion of 85 and correctly calculated the associated confidence interval as 0.77 to 0.93. He also correctly interpreted the interval as “Of all community college students, we are 95% confident that the proportion who intend to get at least a bachelor’s degree is between 0.77 and 0.93.” When asked to interpret the meaning of the phrase “95% confident,” the student wrote “95% confident means that 95% of the time the population proportion lies between 0.77 and 0.93.” But this is incorrect. Use the image of the StatCrunch simulation on the previous page to explain why his interpretation of “95% confident” is incorrect.


A student selected a random sample with a sample proportion of 85 and correctly calculated the associated confidence interval as 0.77 to 0.93. He also correctly interpreted the interval as “Of all community college students, we are 95% confident that the proportion who intend to get at least a bachelor’s degree is between 0.77 and 0.93.”
When asked to interpret the meaning of the phrase “95% confident,” the student wrote “95% confident means that 95% of the time the population proportion lies between 0.77 and 0.93.” But this is incorrect.
Use the image of the StatCrunch simulation on the previous page to explain why
his interpretation of “95% confident” is incorrect.
-The population proportion CI of (0.77, 0.93) is to be interpreted from the specified statement and the simulation. The simulation indicates the true proportion lies within the estimated interval of 0.77 and 0.93 around 94% of the time. Considering the simulation is purely based on the sampling procedure, the considered CI of 95% can not be inferred to be not very indifferent from the percentage of times the interpreted interval contained the estimated population proportion.
Since the population proportion (i.e., the true proportion) is purely based on the population, hence the parameter is fixed for the whole population. Moreover, the CI essentially estimates the true proportion through the sample proportions, and hence the sample proportion is random in nature and depends upon the sample size.
In the statement, the student is observed to have estimated the interval for the population proportion, which is highly undesirable, since the true proportion is not random. So his interpretation is incorrect.

Step by step
Solved in 2 steps


