a. Create a regression model that includes all of the independent variables. b. Calculate the variance. c. Calculate the standard error of each parameter's estimate. In your opinion, how precise are the regression coefficients estimated?
a. Create a regression model that includes all of the independent variables. b. Calculate the variance. c. Calculate the standard error of each parameter's estimate. In your opinion, how precise are the regression coefficients estimated?

MATLAB: An Introduction with Applications
6th Edition
ISBN:9781119256830
Author:Amos Gilat
Publisher:Amos Gilat
Chapter1: Starting With Matlab
Section: Chapter Questions
Problem 1P

Related questions
Question
Transcribed Image Text:x1
x2
x3
x4
x5
x6
bond
width on
bond
pull
strength
loop
height
wire
post
height
observation
die height
width on
length
the die
the post
8.0
5.2
17.0
28.6
83.0
1.9
1.6
2.
8.0
5.2
19.6
29.6
94.9
2.1
2,3
3
8.3
5.8
19.8
32.4
89.7
2.1
1.8
4.
8.5
6.4
19.6
31.0
96.2
2.0
2.0
8.8
5.8
19.4
32.4
95.6
2.2
2.1
6
9.0
5.2
18.6
28.6
86.5
2.0
1.8
7
9.3
5.6
18.8
30.6
84.5
2.1
2.1
9.3
6.0
20.4
32.4
88.8
2.2
1.9
9.5
5.2
19.0
32.6
85.7
2.1
1.9
10
9.8
5.8
20.8
32.2
93.6
2.3
2.1
11
10.0
6.4
19.9
31.8
86.0
2.1
1.8
12
10.3
б.0
18.0
32.6
87.1
2.0
1.6
13
10.5
6.2
20.6
33.4
93.1
2.1
2.1
14
10.8
6.2
20.2
31.8
83.4
2.2
2.1
15
11.0
6.2
20.2
32.4
94.5
2.1
1.9
16
11.3
5.6
19.2
31.4
83.4
1.9
1.8
17
11.5
6.0
17.0
33.2
85.2
2.1
2.1
18
11.8
5.8
19.8
35.4
84.1
2.0
1.8
19
12.0
6.5
19.4
32.2
88.5
2.1
1.9
20
12.3
5.6
18.8
34.0
86.9
2.1
1.8
21
12.5
18.6
18.6
34.2
83.0
1.9
2.0
22
12.5
18.6
20.8
35.4
96.2
2.3
2.3
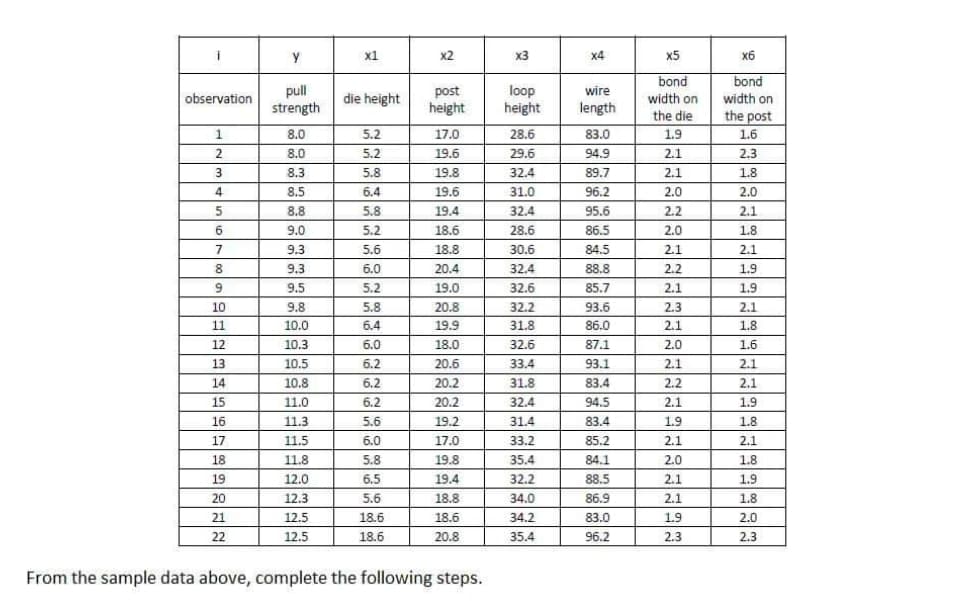
From the sample data above, complete the following steps.
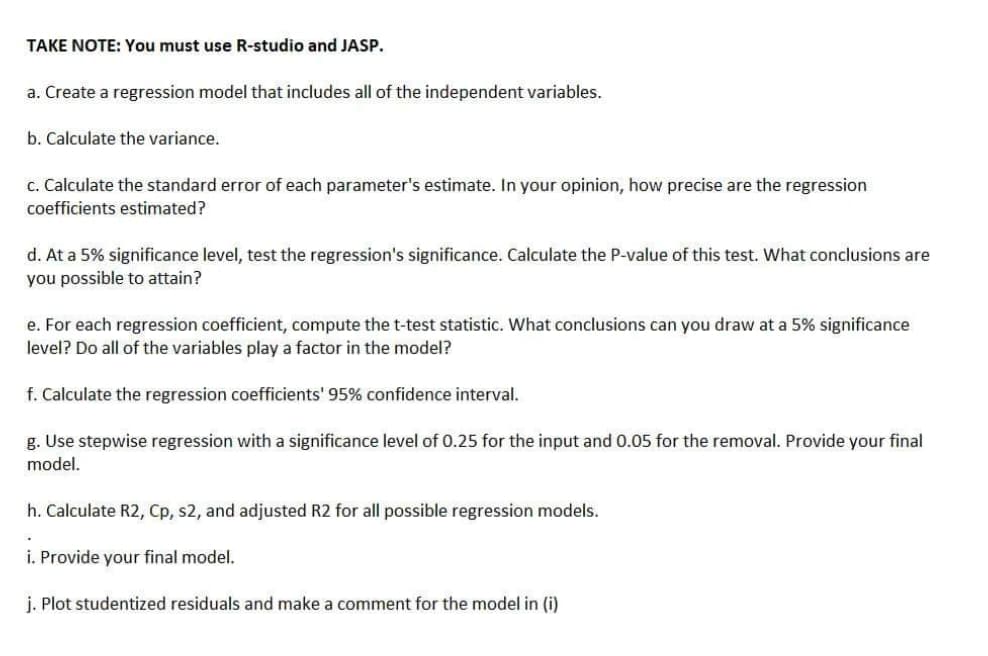
Transcribed Image Text:TAKE NOTE: You must use R-studio and JASP.
a. Create a regression model that includes all of the independent variables.
b. Calculate the variance.
c. Calculate the standard error of each parameter's estimate. In your opinion, how precise are the regression
coefficients estimated?
d. At a 5% significance level, test the regression's significance. Calculate the P-value of this test. What conclusions are
you possible to attain?
e. For each regression coefficient, compute the t-test statistic. What conclusions can you draw at a 5% significance
level? Do all of the variables play a factor in the model?
f. Calculate the regression coefficients' 95% confidence interval.
g. Use stepwise regression with a significance level of 0.25 for the input and 0.05 for the removal. Provide your final
model.
h. Calculate R2, Cp, s2, and adjusted R2 for all possible regression models.
i. Provide your final model.
j. Plot studentized residuals and make a comment for the model in (i)
Expert Solution
This question has been solved!
Explore an expertly crafted, step-by-step solution for a thorough understanding of key concepts.

Step by step
Solved in 5 steps

Recommended textbooks for you
MATLAB: An Introduction with Applications
Statistics
ISBN:
9781119256830
Author:
Amos Gilat
Publisher:
John Wiley & Sons Inc

Probability and Statistics for Engineering and th…
Statistics
ISBN:
9781305251809
Author:
Jay L. Devore
Publisher:
Cengage Learning

Statistics for The Behavioral Sciences (MindTap C…
Statistics
ISBN:
9781305504912
Author:
Frederick J Gravetter, Larry B. Wallnau
Publisher:
Cengage Learning
MATLAB: An Introduction with Applications
Statistics
ISBN:
9781119256830
Author:
Amos Gilat
Publisher:
John Wiley & Sons Inc
Probability and Statistics for Engineering and th…
Statistics
ISBN:
9781305251809
Author:
Jay L. Devore
Publisher:
Cengage Learning
Statistics for The Behavioral Sciences (MindTap C…
Statistics
ISBN:
9781305504912
Author:
Frederick J Gravetter, Larry B. Wallnau
Publisher:
Cengage Learning

Elementary Statistics: Picturing the World (7th E…
Statistics
ISBN:
9780134683416
Author:
Ron Larson, Betsy Farber
Publisher:
PEARSON

The Basic Practice of Statistics
Statistics
ISBN:
9781319042578
Author:
David S. Moore, William I. Notz, Michael A. Fligner
Publisher:
W. H. Freeman

Introduction to the Practice of Statistics
Statistics
ISBN:
9781319013387
Author:
David S. Moore, George P. McCabe, Bruce A. Craig
Publisher:
W. H. Freeman