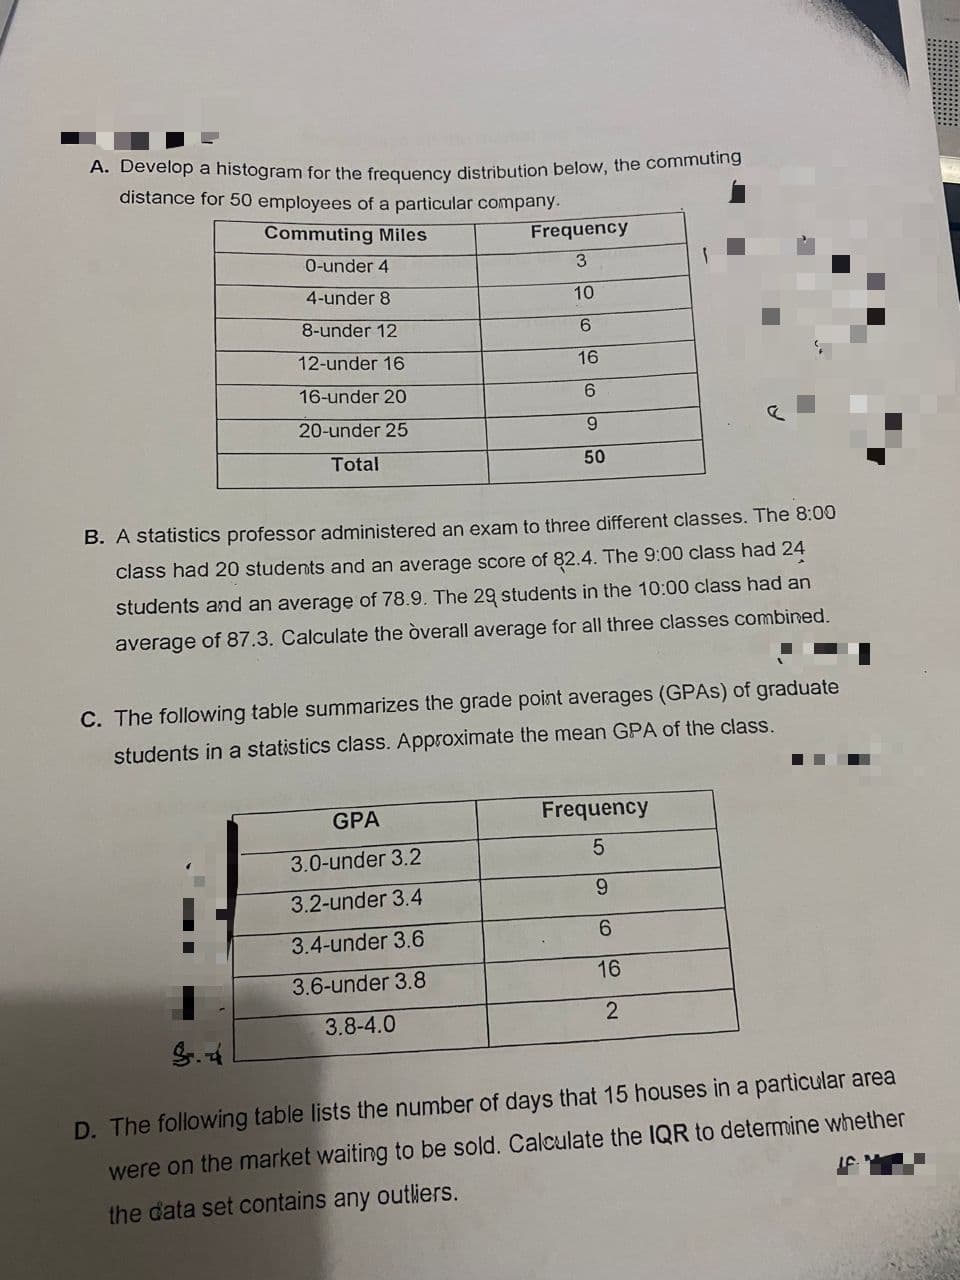
A. Develop a histogram for the frequency distribution below, the commuting distance for 50 employees of a particular company.
A. Develop a histogram for the frequency distribution below, the commuting distance for 50 employees of a particular company.

Glencoe Algebra 1, Student Edition, 9780079039897, 0079039898, 2018
18th Edition
ISBN:9780079039897
Author:Carter
Publisher:Carter
Chapter10: Statistics
Section10.4: Distributions Of Data
Problem 19PFA

Related questions
Question
Transcribed Image Text:A. Develop a histogram for the frequency distribution below, the commuting
distance for 50 employees of a particular company.
Commuting Miles
Frequency
0-under 4
4-under 8
10
8-under 12
6
12-under 16
16
16-under 20
6.
20-under 25
Total
50
B. A statistics professor administered an exam to three different classes. The 8:00
class had 20 students and an average score of 82.4. The 9:00 class had 24
students and an average of 78.9. The 29 students in the 10:00 class had an
average of 87.3. Calculate the òverall average for all three classes combined.
C. The following table summarizes the grade point averages (GPAS) of graduate
students in a statistics class. Approximate the mean GPA of the class.
GPA
Frequency
3.0-under 3.2
6.
3.2-under 3.4
6.
3.4-under 3.6
3.6-under 3.8
16
3.8-4.0
2
D. The following table lists the number of days that 15 houses in a particular area
were on the market waiting to be sold. Calculate the IQR to determine whether
the data set contains any outliers.
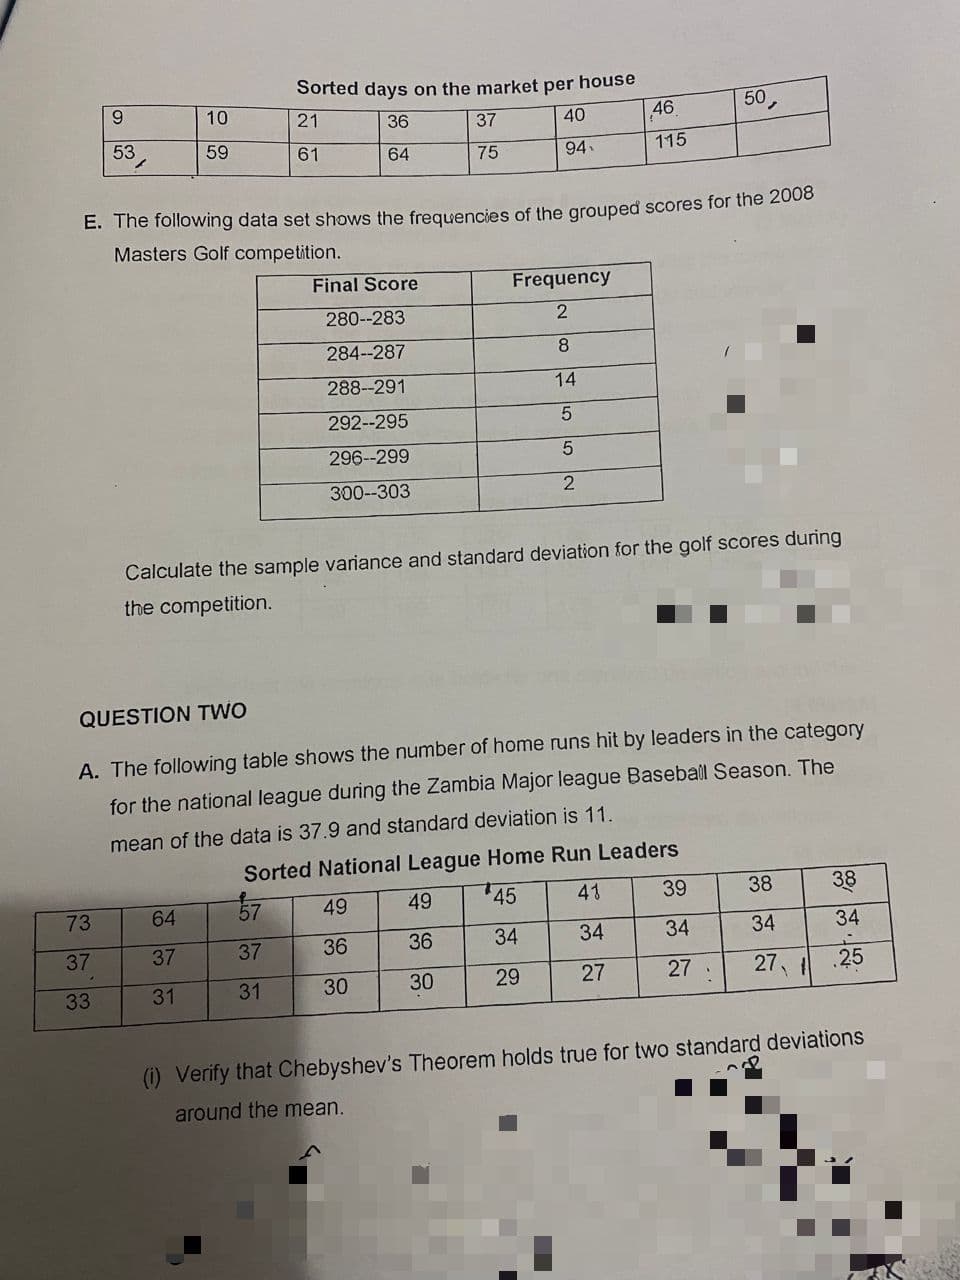
Transcribed Image Text:Sorted days on the market per house
9.
10
21
40
46
50,
36
37
59
61
64
75
94.
115
E. The following data set shows the frequencies of the grouped scores for the 2006
Masters Golf competition.
Final Score
Frequency
280--283
2
284--287
288-291
14
292--295
296--299
300-303
Calculate the sample variance and standard deviation for the golf scores during
the competition.
QUESTION TWO
A. The following table shows the number of home runs hit by leaders in the category
for the national league during the Zambia Major league Baseball Season. The
mean of the data is 37.9 and standard deviation is 11.
Sorted National League Home Run Leaders
45
41
39
38
38
49
49
73
64
36
34
34
34
34
34
37
37
37
36
27
27 :
27.
25
33
31
31
30
30
29
(i) Verify that Chebyshev's Theorem holds true for two standard deviations
around the mean.
Expert Solution
This question has been solved!
Explore an expertly crafted, step-by-step solution for a thorough understanding of key concepts.

Step by step
Solved in 7 steps with 4 images

Recommended textbooks for you
Glencoe Algebra 1, Student Edition, 9780079039897…
Algebra
ISBN:
9780079039897
Author:
Carter
Publisher:
McGraw Hill
Glencoe Algebra 1, Student Edition, 9780079039897…
Algebra
ISBN:
9780079039897
Author:
Carter
Publisher:
McGraw Hill