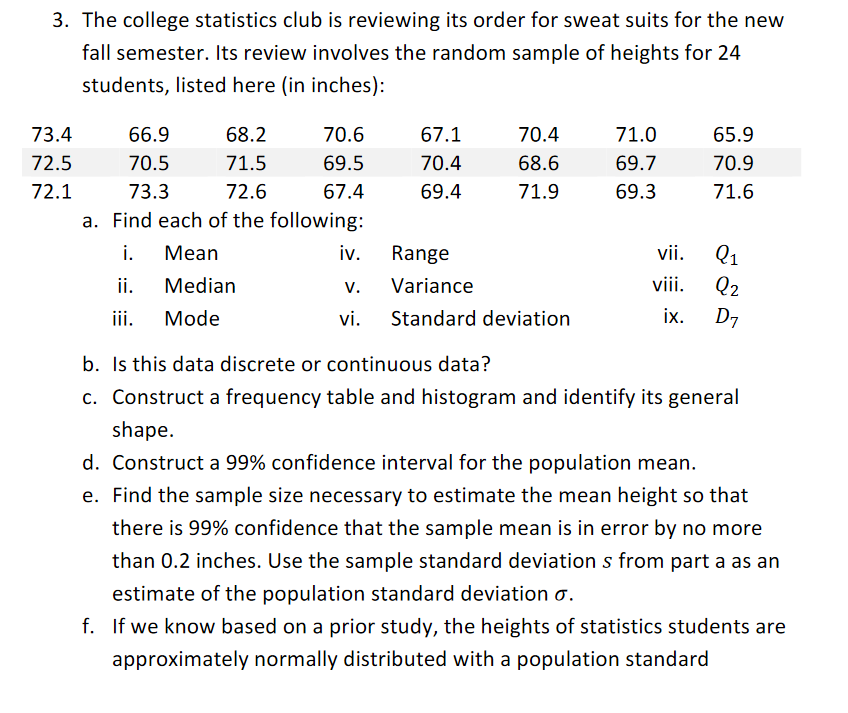
a. Find each of the following: i. Mean iv. Range vii. Q1 ii. Median Variance viii. Q2 v. iii. Mode vi. Standard deviation ix. D7 b. Is this data discrete or continuous data? c. Construct a frequency table and histogram and identify its general shape.

Glencoe Algebra 1, Student Edition, 9780079039897, 0079039898, 2018
18th Edition
ISBN:9780079039897
Author:Carter
Publisher:Carter
Chapter10: Statistics
Section10.4: Distributions Of Data
Problem 19PFA
icon
Related questions
icon
Concept explainers
Topic Video
Question
3. The college statistics club is reviewing its order for sweat suits for the new
fall semester. Its review involves the random sample of heights for 24
students, listed here (in inches):
73.4
66.9
68.2
70.6
67.1
70.4
71.0
65.9
72.5
70.5
71.5
69.5
70.4
68.6
69.7
70.9
72.1
73.3
72.6
67.4
69.4
71.9
69.3
71.6
a. Find each of the following:
i.
Мean
iv.
Range
vii.
Q1
Median
viii.
Q2
ix.
ii.
v.
Variance
ii.
Mode
vi.
Standard deviation
D7
b. Is this data discrete or continuous data?
c. Construct a frequency table and histogram and identify its general
shape.
d. Construct a 99% confidence interval for the population mean.
e. Find the sample size necessary to estimate the mean height so that
there is 99% confidence that the sample mean is in error by no more
than 0.2 inches. Use the sample standard deviation s from part a as an
estimate of the population standard deviation o.
f. If we know based on a prior study, the heights of statistics students are
approximately normally distributed with a population standard
Transcribed Image Text:3. The college statistics club is reviewing its order for sweat suits for the new fall semester. Its review involves the random sample of heights for 24 students, listed here (in inches): 73.4 66.9 68.2 70.6 67.1 70.4 71.0 65.9 72.5 70.5 71.5 69.5 70.4 68.6 69.7 70.9 72.1 73.3 72.6 67.4 69.4 71.9 69.3 71.6 a. Find each of the following: i. Мean iv. Range vii. Q1 Median viii. Q2 ix. ii. v. Variance ii. Mode vi. Standard deviation D7 b. Is this data discrete or continuous data? c. Construct a frequency table and histogram and identify its general shape. d. Construct a 99% confidence interval for the population mean. e. Find the sample size necessary to estimate the mean height so that there is 99% confidence that the sample mean is in error by no more than 0.2 inches. Use the sample standard deviation s from part a as an estimate of the population standard deviation o. f. If we know based on a prior study, the heights of statistics students are approximately normally distributed with a population standard
Expert Solution
steps

Step by step

Solved in 5 steps with 1 images

Blurred answer
Knowledge Booster
Centre, Spread, and Shape of a Distribution
Learn more about
Need a deep-dive on the concept behind this application? Look no further. Learn more about this topic, statistics and related others by exploring similar questions and additional content below.
Recommended textbooks for you
Glencoe Algebra 1, Student Edition, 9780079039897…
Algebra
ISBN:
9780079039897
Author:
Carter
Publisher:
McGraw Hill