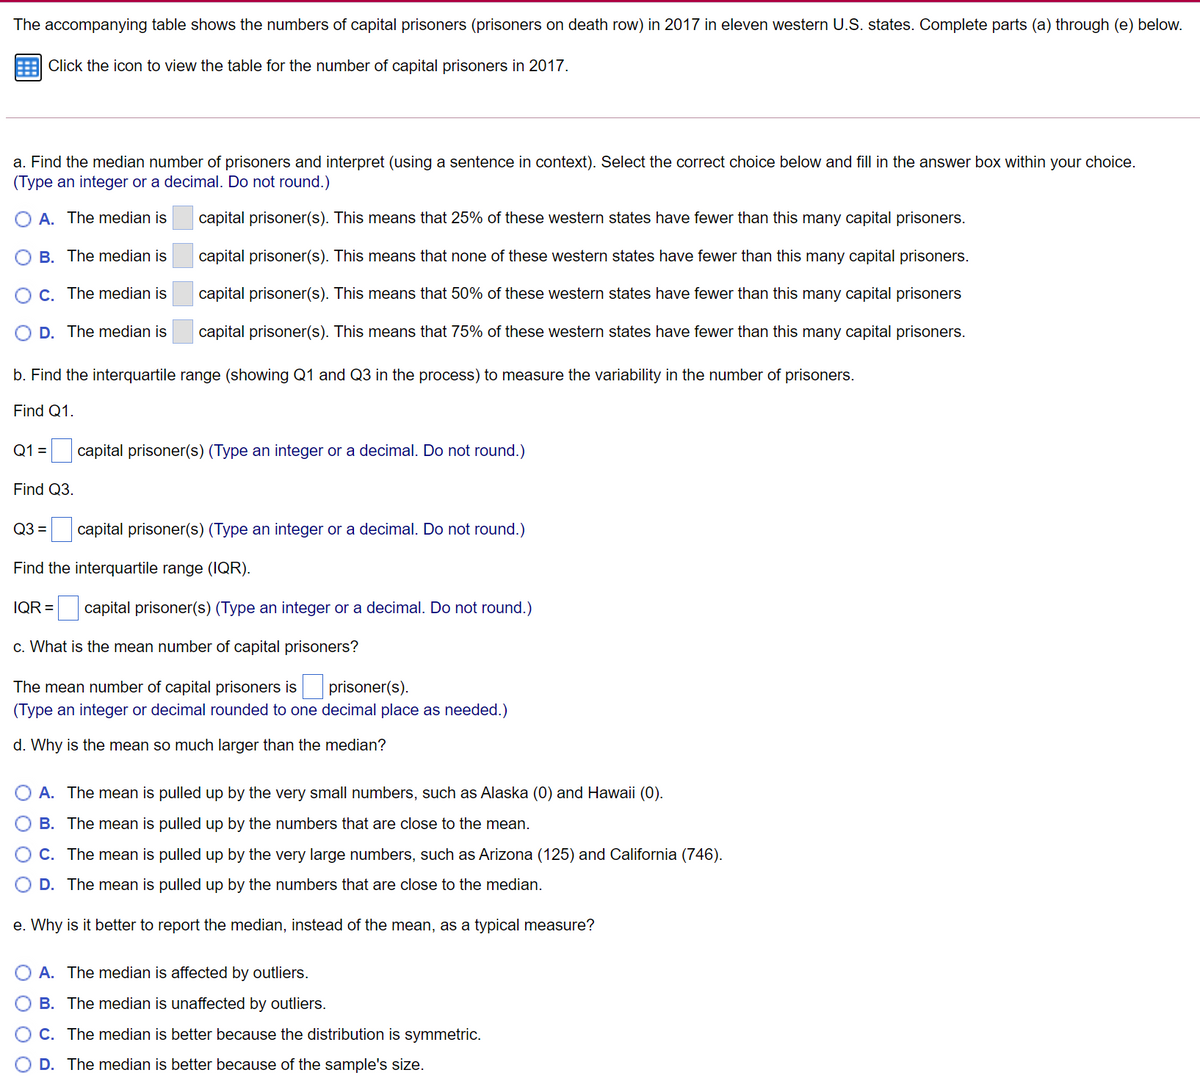
a. Find the median number of prisoners and interpret (using a sentence in context). Select the correct choice below and fill in the answer box within your c (Type an integer or a decimal. Do not round.) O A. The median is capital prisoner(s). This means that 25% of these western states have fewer than this many capital prisoners. O B. The median is capital prisoner(s). This means that none of these western states have fewer than this many capital prisoners. OC. The median is capital prisoner(s). This means that 50% of these western states have fewer than this many capital prisoners O D. The median is capital prisoner(s). This means that 75% of these western states have fewer than this many capital prisoners. b. Find the interquartile range (showing Q1 and Q3 in the process) to measure the variability in the number of prisoners. Find Q1. Q1 = capital prisoner(s) (Type an integer or a decimal. Do not round.) Find Q3. Q3 = capital prisoner(s) (Type an integer or a decimal. Do not round.) Find the interquartile range (IQR). IQR = capital prisoner(s) (Type an integer or a decimal. Do not round.) c. What is the mean number of capital prisoners? The mean number of capital prisoners is prisoner(s). (Type an integer or decimal rounded to one decimal place as needed.)


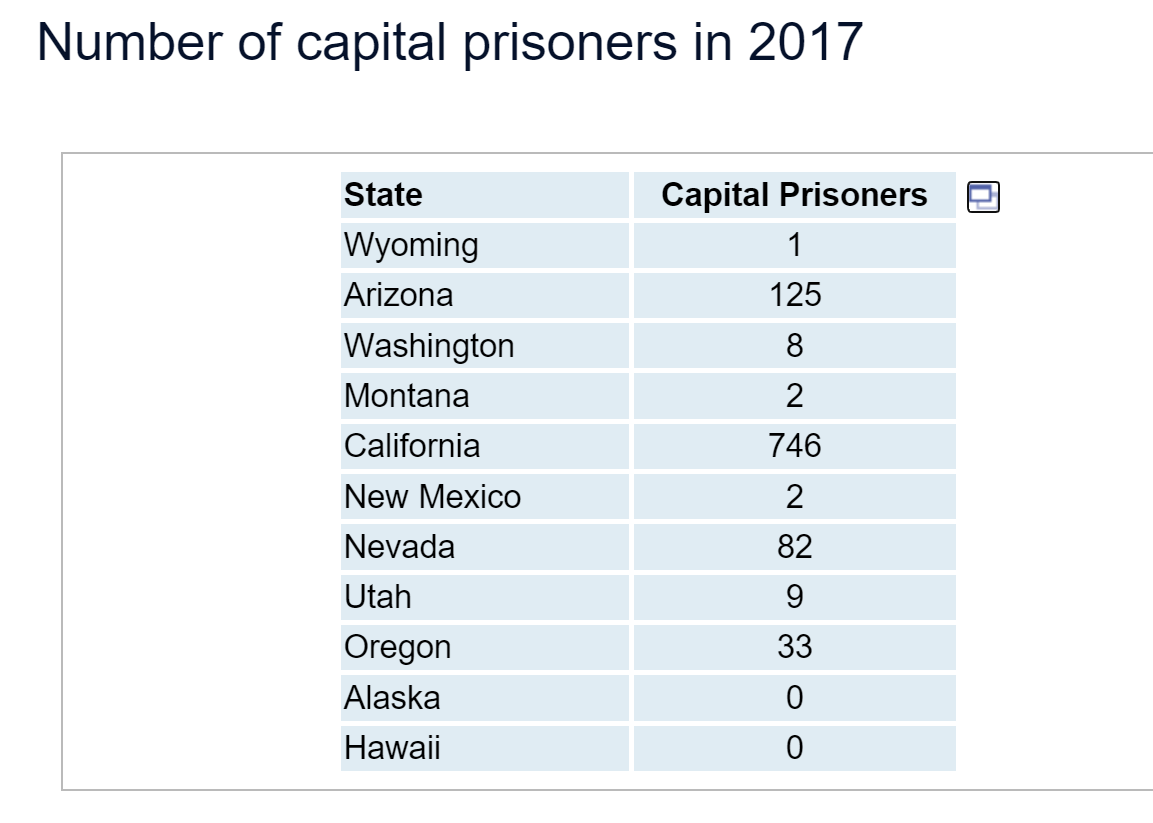
The accompanying table shows the numbers of capital prisoners (prisoners on death row) in 2017 in eleven western U.S. states. Complete parts (a) through (e) below.
Since you have posted a question with multiple subparts we will solve first three subparts for you. To get remaining subparts solved, please repost the question and mention the subparts to be solved.
Quartile used to measure the location of the data set and it splits the entire data set into four part with three points. There are three points they are quartile 1, quartile 2 and quartile 3. Inter quartile range is calculated using the measures quartile 1 and quartile 3 and it is denoted as :
Mean is used to measure the average of all the observation in the sample and it is defined as :

Trending now
This is a popular solution!

Step by step
Solved in 2 steps


