A. Rearrange the data in step 1c. from highest to lowest numbers. (Put a space between each pairs of numbers.) B. Label the Parentals (= the pair of numbers that are the most frequent) versus Recombinants. C. Further subdivide recombinants as single crossovers region 1", single crossovers region 2*, double crossovers (-least frequent). [*note: single cross overs are the two pairs that are intermediate between parentals and double cross overs.] and
A. Rearrange the data in step 1c. from highest to lowest numbers. (Put a space between each pairs of numbers.) B. Label the Parentals (= the pair of numbers that are the most frequent) versus Recombinants. C. Further subdivide recombinants as single crossovers region 1", single crossovers region 2*, double crossovers (-least frequent). [*note: single cross overs are the two pairs that are intermediate between parentals and double cross overs.] and

Biology: The Unity and Diversity of Life (MindTap Course List)
15th Edition
ISBN:9781337408332
Author:Cecie Starr, Ralph Taggart, Christine Evers, Lisa Starr
Publisher:Cecie Starr, Ralph Taggart, Christine Evers, Lisa Starr
Chapter13: Observing Patterns In Inherited Traits
Section: Chapter Questions
Problem 7SQ: A testcross is a way to determine ________. a. phenotype b. genotype c. dominance

Related questions

Topic Video
Question
![A. Rearrange the data in step 1c. from highest to lowest numbers. (Put a space between each
pairs of numbers.)
B. Label the Parentals (= the pair of numbers that are the most frequent) versus Recombinants.
C. Further subdivide recombinants as single crossovers region 1", single crossovers region 2*, and
double crossovers (-least frequent). [*note: single cross overs are the two pairs that are
intermediate between parentals and double cross overs.]](/v2/_next/image?url=https%3A%2F%2Fcontent.bartleby.com%2Fqna-images%2Fquestion%2Feb62ec4b-b625-4332-acd2-c86081f32c3c%2F395d13e2-8ea3-4b6c-82a1-a13f3d4f048d%2Fr46ktpj_processed.jpeg&w=3840&q=75)
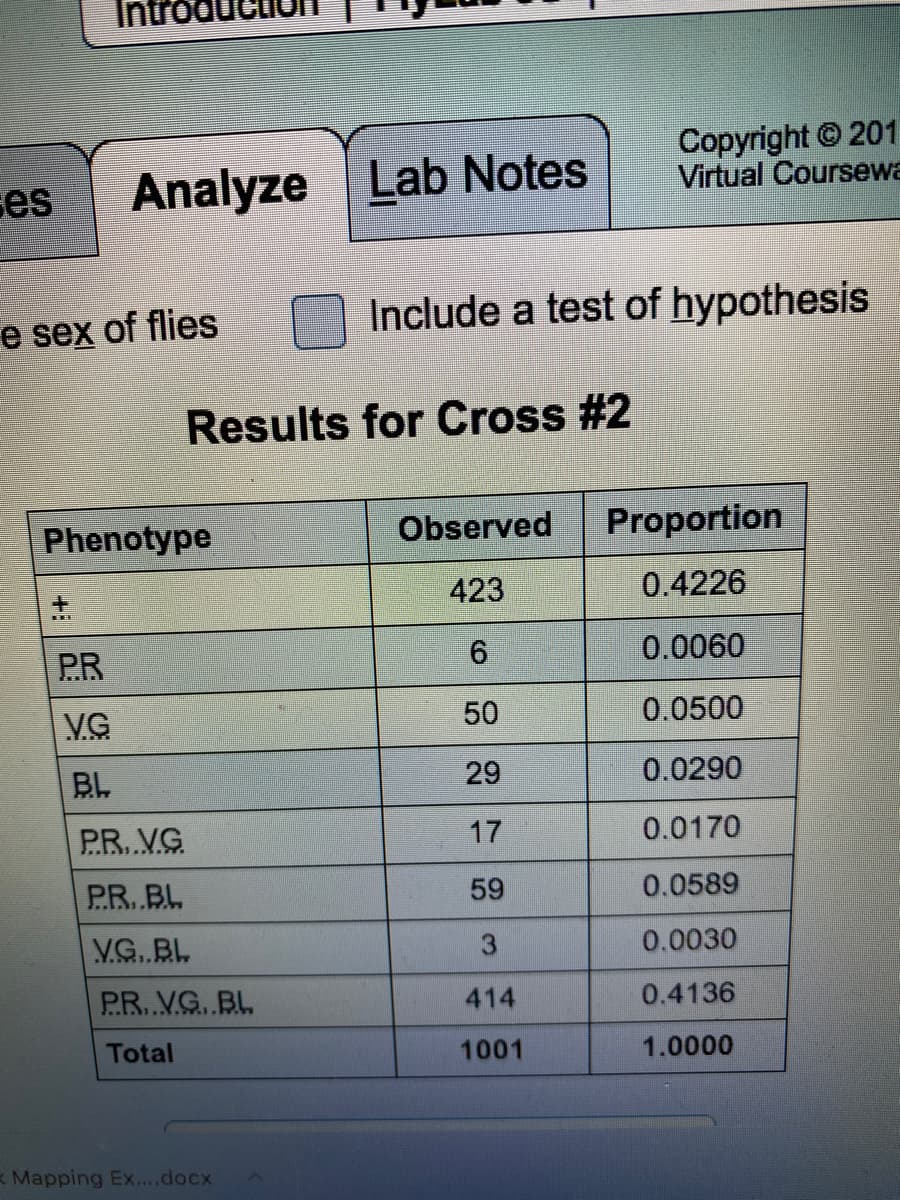
Transcribed Image Text:A. Rearrange the data in step 1c. from highest to lowest numbers. (Put a space between each
pairs of numbers.)
B. Label the Parentals (= the pair of numbers that are the most frequent) versus Recombinants.
C. Further subdivide recombinants as single crossovers region 1", single crossovers region 2*, and
double crossovers (-least frequent). [*note: single cross overs are the two pairs that are
intermediate between parentals and double cross overs.]
Transcribed Image Text:Copyright © 201
Virtual Coursewa
ses
Analyze Lab Notes
Include a test of hypothesis
e sex of flies
Results for Cross #2
Observed
Proportion
Phenotype
423
0.4226
0.0060
PR
50
0.0500
VG
29
0.0290
BL
17
0.0170
PR. VG
PR. BL
59
0.0589
V.G. BL
3.
0.0030
P.R.V.G. BL
414
0.4136
Total
1001
1.0000
Mapping Ex....docx
Expert Solution
This question has been solved!
Explore an expertly crafted, step-by-step solution for a thorough understanding of key concepts.

This is a popular solution!

Trending now
This is a popular solution!

Step by step
Solved in 3 steps with 1 images

Knowledge Booster


Learn more about
Need a deep-dive on the concept behind this application? Look no further. Learn more about this topic, biology and related others by exploring similar questions and additional content below.Recommended textbooks for you
Biology: The Unity and Diversity of Life (MindTap…
Biology
ISBN:
9781337408332
Author:
Cecie Starr, Ralph Taggart, Christine Evers, Lisa Starr
Publisher:
Cengage Learning
Biology: The Unity and Diversity of Life (MindTap…
Biology
ISBN:
9781337408332
Author:
Cecie Starr, Ralph Taggart, Christine Evers, Lisa Starr
Publisher:
Cengage Learning