a. Suppose you want to graph the distribution of profits. Explain why using only one stem- plot might not be optimal for the analysis. b. Describe the correct stemplot to use. Generate this stemplot. Explain your steps. What can you say about the distribution from this stemplot? c. When are stemplots useful? And why is that?
a. Suppose you want to graph the distribution of profits. Explain why using only one stem- plot might not be optimal for the analysis. b. Describe the correct stemplot to use. Generate this stemplot. Explain your steps. What can you say about the distribution from this stemplot? c. When are stemplots useful? And why is that?
Glencoe Algebra 1, Student Edition, 9780079039897, 0079039898, 2018
18th Edition
ISBN:9780079039897
Author:Carter
Publisher:Carter
Chapter10: Statistics
Section10.6: Summarizing Categorical Data
Problem 23PPS
Related questions
Question

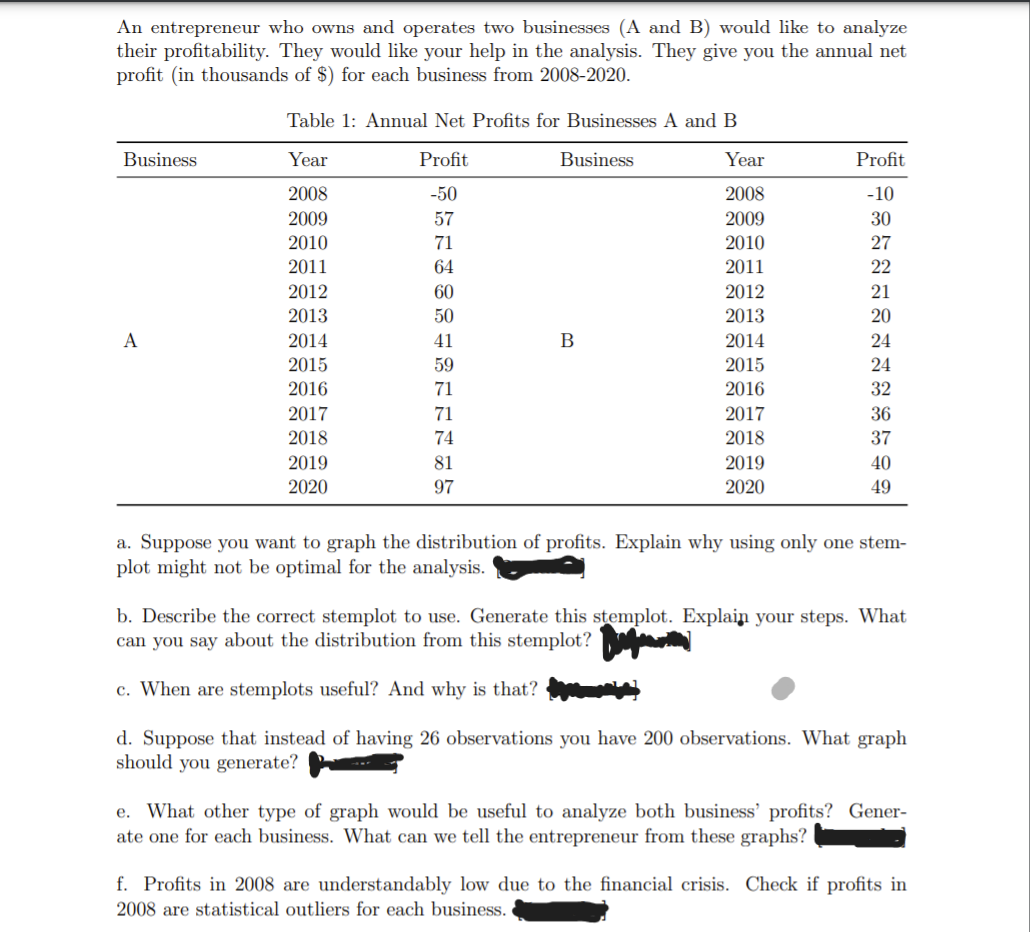
Transcribed Image Text:An entrepreneur who owns and operates two businesses (A and B) would like to analyze
their profitability. They would like your help in the analysis. They give you the annual net
profit (in thousands of $) for each business from 2008-2020.
Table 1: Annual Net Profits for Businesses A and B
Business
Year
Profit
Business
Year
Profit
2008
-50
2008
-10
2009
57
2009
30
2010
71
2010
27
2011
64
2011
22
2012
60
2012
21
2013
50
2013
20
A
2014
41
2014
24
2015
59
2015
24
2016
71
2016
32
2017
71
2017
36
2018
74
2018
37
019
81
20
40
2020
97
2020
49
a. Suppose you want to graph the distribution of profits. Explain why using only one stem-
plot might not be optimal for the analysis.
b. Describe the correct stemplot to use. Generate this stemplot. Explain your steps. What
can you say about the distribution from this stemplot?
c. When are stemplots useful? And why is that?
d. Suppose that instead of having 26 observations you have 200 observations. What graph
should you generate?
e. What other type of graph would be useful to analyze both business' profits? Gener-
ate one for each business. What can we tell the entrepreneur from these graphs?
f. Profits in 2008 are understandably low due to the financial crisis. Check if profits in
2008 are statistical outliers for each business.
Expert Solution
This question has been solved!
Explore an expertly crafted, step-by-step solution for a thorough understanding of key concepts.
This is a popular solution!
Trending now
This is a popular solution!
Step by step
Solved in 2 steps with 2 images

Recommended textbooks for you

Glencoe Algebra 1, Student Edition, 9780079039897…
Algebra
ISBN:
9780079039897
Author:
Carter
Publisher:
McGraw Hill

Holt Mcdougal Larson Pre-algebra: Student Edition…
Algebra
ISBN:
9780547587776
Author:
HOLT MCDOUGAL
Publisher:
HOLT MCDOUGAL

Big Ideas Math A Bridge To Success Algebra 1: Stu…
Algebra
ISBN:
9781680331141
Author:
HOUGHTON MIFFLIN HARCOURT
Publisher:
Houghton Mifflin Harcourt

Glencoe Algebra 1, Student Edition, 9780079039897…
Algebra
ISBN:
9780079039897
Author:
Carter
Publisher:
McGraw Hill

Holt Mcdougal Larson Pre-algebra: Student Edition…
Algebra
ISBN:
9780547587776
Author:
HOLT MCDOUGAL
Publisher:
HOLT MCDOUGAL

Big Ideas Math A Bridge To Success Algebra 1: Stu…
Algebra
ISBN:
9781680331141
Author:
HOUGHTON MIFFLIN HARCOURT
Publisher:
Houghton Mifflin Harcourt