3. Use the graph below to answer the following questions. Distribution of annual household income in the United States (2012 estimate) percent of households Median household income was roughly $51,000. These two groups include households reporting income greater than $200,000 (approximately 4 percent households). The top 25 percent reported an income grater than $85,000. Source: US. Census Bureau, Current Population Survey, 2012 Annual Social and Economic Supplement a) What is the shape of the distribution of annual household income in the U.S.? b) What was the median household income in 2012 and what does it mean? es es hes s IS NIS 516,000to 599999 666 S 0es Under S0
3. Use the graph below to answer the following questions. Distribution of annual household income in the United States (2012 estimate) percent of households Median household income was roughly $51,000. These two groups include households reporting income greater than $200,000 (approximately 4 percent households). The top 25 percent reported an income grater than $85,000. Source: US. Census Bureau, Current Population Survey, 2012 Annual Social and Economic Supplement a) What is the shape of the distribution of annual household income in the U.S.? b) What was the median household income in 2012 and what does it mean? es es hes s IS NIS 516,000to 599999 666 S 0es Under S0

Algebra: Structure And Method, Book 1
(REV)00th Edition
ISBN:9780395977224
Author:Richard G. Brown, Mary P. Dolciani, Robert H. Sorgenfrey, William L. Cole
Publisher:Richard G. Brown, Mary P. Dolciani, Robert H. Sorgenfrey, William L. Cole
Chapter8: Introduction To Functions
Section8.6: Functions Defined By Tables And Graphs
Problem 10WE

Related questions
Question
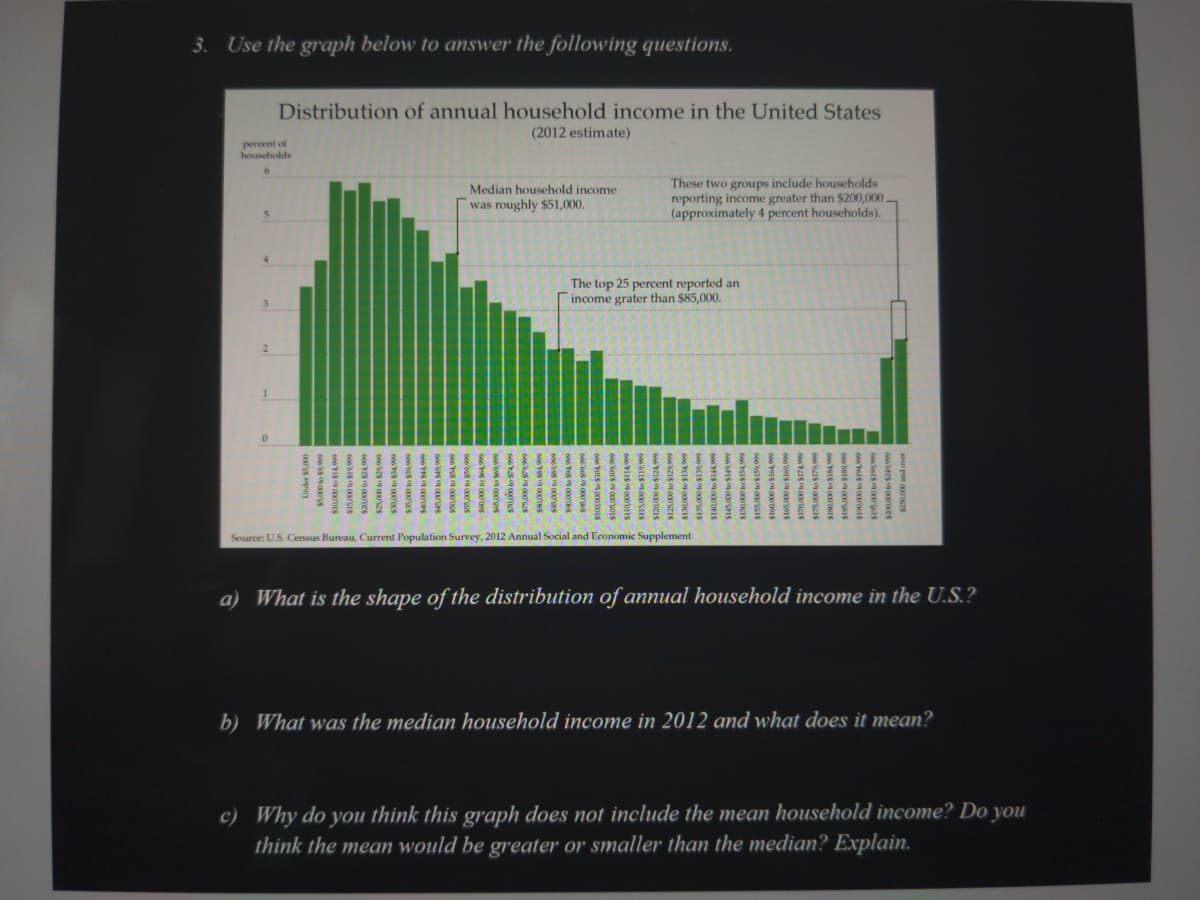
Transcribed Image Text:3. Use the graph below to answer the following questions.
Distribution of annual household income in the United States
(2012 estimate)
percent of
households
Median household income
was roughly $51,000.
These two groups include households
reporting income greater than $200,000 –
(approximately 4 percent households).
The top 25 percent reported an
income grater than $85,000.
Source: U.S. Census Bureau, Current Population Survey, 2012 Annual Social and Economie Supplement
a) What is the shape of the distribution of annual household income in the U.S.?
b) What was the median household income in 2012 and what does it mean?
c) Why do you think this graph does not include the mean household income? Do you
think the mean would be greater or smaller than the median? Explain.
Expert Solution
This question has been solved!
Explore an expertly crafted, step-by-step solution for a thorough understanding of key concepts.

This is a popular solution!

Trending now
This is a popular solution!

Step by step
Solved in 2 steps with 1 images

Recommended textbooks for you
Algebra: Structure And Method, Book 1
Algebra
ISBN:
9780395977224
Author:
Richard G. Brown, Mary P. Dolciani, Robert H. Sorgenfrey, William L. Cole
Publisher:
McDougal Littell

Holt Mcdougal Larson Pre-algebra: Student Edition…
Algebra
ISBN:
9780547587776
Author:
HOLT MCDOUGAL
Publisher:
HOLT MCDOUGAL

Glencoe Algebra 1, Student Edition, 9780079039897…
Algebra
ISBN:
9780079039897
Author:
Carter
Publisher:
McGraw Hill
Algebra: Structure And Method, Book 1
Algebra
ISBN:
9780395977224
Author:
Richard G. Brown, Mary P. Dolciani, Robert H. Sorgenfrey, William L. Cole
Publisher:
McDougal Littell
Holt Mcdougal Larson Pre-algebra: Student Edition…
Algebra
ISBN:
9780547587776
Author:
HOLT MCDOUGAL
Publisher:
HOLT MCDOUGAL
Glencoe Algebra 1, Student Edition, 9780079039897…
Algebra
ISBN:
9780079039897
Author:
Carter
Publisher:
McGraw Hill