A. The sample mean was lower for the students who planned to go to graduate school, but the times were also mu B. The sample mean was higher for the students who planned to go to graduate school, but the times were also mu C. The sample mean was higher for the students who planned to go to graduate school, but the times were also mu D. The sample mean was lower for the students who planned to go to graduate school, but the times were also mu Find the standard error for the difference between the sample means. Interpret. and the standard error for the difference between the sample means.
A. The sample mean was lower for the students who planned to go to graduate school, but the times were also mu B. The sample mean was higher for the students who planned to go to graduate school, but the times were also mu C. The sample mean was higher for the students who planned to go to graduate school, but the times were also mu D. The sample mean was lower for the students who planned to go to graduate school, but the times were also mu Find the standard error for the difference between the sample means. Interpret. and the standard error for the difference between the sample means.

Glencoe Algebra 1, Student Edition, 9780079039897, 0079039898, 2018
18th Edition
ISBN:9780079039897
Author:Carter
Publisher:Carter
Chapter10: Statistics
Section10.5: Comparing Sets Of Data
Problem 26PFA

Related questions
Question
Question 6, 10.2.29
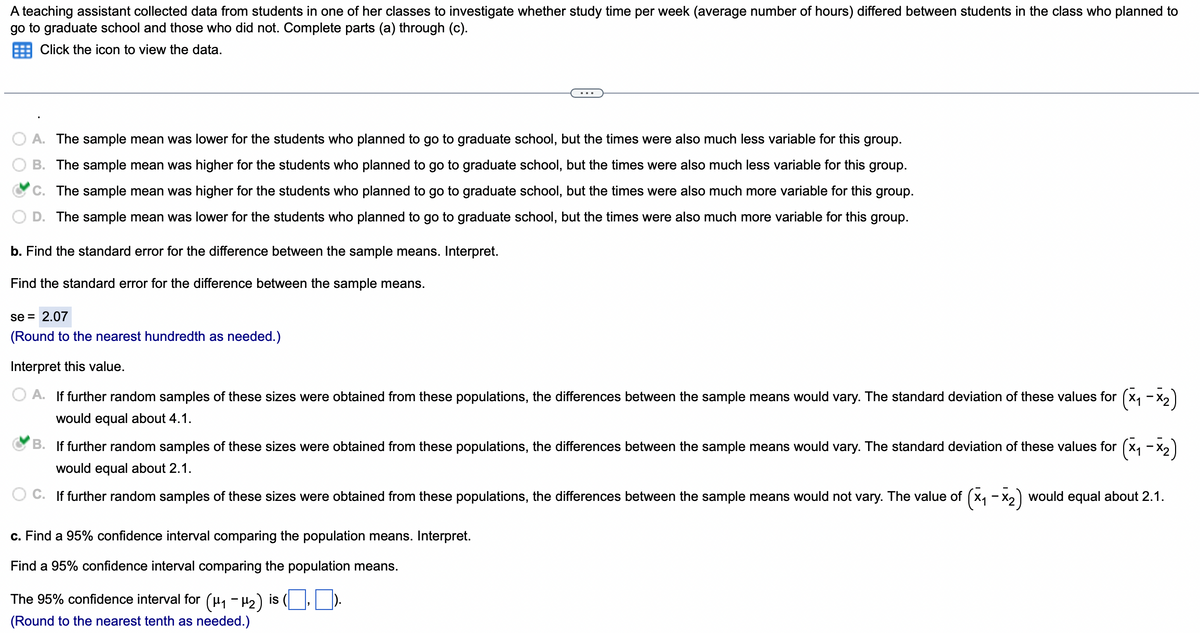
Transcribed Image Text:A teaching assistant collected data from students in one of her classes to investigate whether study time per week (average number of hours) differed between students in the class who planned to
go to graduate school and those who did not. Complete parts (a) through (c).
Click the icon to view the data.
A. The sample mean was lower for the students who planned to go to graduate school, but the times were also much less variable for this group.
B. The sample mean was higher for the students who planned to go to graduate school, but the times were also much less variable for this group.
C. The sample mean was higher for the students who planned to go to graduate school, but the times were also much more variable for this group.
D. The sample mean was lower for the students who planned to go to graduate school, but the times were also much more variable for this group.
b. Find the standard error for the difference between the sample means. Interpret.
Find the standard error for the difference between the sample means.
se = 2.07
(Round to the nearest hundredth as needed.)
Interpret this value.
OA. If further random samples of these sizes were obtained from these populations, the differences between the sample means would vary. The standard deviation of these values for (x₁-x₂)
would equal about 4.1.
B. If further random samples of these sizes were obtained from these populations, the differences between the sample means would vary. The standard deviation of these values for (x₁-x₂)
would equal about 2.1.
C. If further random samples of these sizes were obtained from these populations, the differences between the sample means would not vary. The value of (x₁ - x₂) would equal about 2.1.
c. Find a 95% confidence interval comparing the population means. Interpret.
Find a 95% confidence interval comparing the population means.
1,0).
-
The 95% confidence interval for (μ₁ −μ₂) is
(Round to the nearest tenth as needed.)

Transcribed Image Text:Graduate school: 16, 7, 15, 10, 5, 5, 2, 3, 12, 16, 15, 35, 8,
14, 10, 19, 3, 27, 15, 5, 5
No graduate school: 6, 8, 13, 6, 5, 13, 10, 10, 12, 5
Full data set
n
Expert Solution
This question has been solved!
Explore an expertly crafted, step-by-step solution for a thorough understanding of key concepts.

Step by step
Solved in 2 steps with 4 images

Recommended textbooks for you
Glencoe Algebra 1, Student Edition, 9780079039897…
Algebra
ISBN:
9780079039897
Author:
Carter
Publisher:
McGraw Hill

Big Ideas Math A Bridge To Success Algebra 1: Stu…
Algebra
ISBN:
9781680331141
Author:
HOUGHTON MIFFLIN HARCOURT
Publisher:
Houghton Mifflin Harcourt
Glencoe Algebra 1, Student Edition, 9780079039897…
Algebra
ISBN:
9780079039897
Author:
Carter
Publisher:
McGraw Hill
Big Ideas Math A Bridge To Success Algebra 1: Stu…
Algebra
ISBN:
9781680331141
Author:
HOUGHTON MIFFLIN HARCOURT
Publisher:
Houghton Mifflin Harcourt