a. Use the figure to fill in the quantity supplied given supply curve S, for each price in the following table (second column, gray-shaded cells). Instructions: If you are entering any negative numbers be sure to include a negative sign (-) in front of those numbers. S1 Quantity Supplied S2 Quantity Supplied |Change in Quantity Supplied Price 3 4 2 b. If production costs were to increase, the quantities supplied at each price would be as shown by the third column of the table ("S, Quantity Supplied"). Use those data to draw supply curve S, using the graph below. Instructions: On the graph below, use your mouse to click and drag supply curve S, as necessary, or you may move the individual points. 5 4 s, 2 1 10 15 20 Quantity supplied c. In the fourth column (gray-shaded cells) of the table in part a, enter the amount by which the quantity supplied at each price changes due to the increase in product costs. (Use positive numbers for increases and negative numbers for decreases.) d. Did the increase in production costs cause a "decrease in supply" or a "decrease in quantity supplied"?
a. Use the figure to fill in the quantity supplied given supply curve S, for each price in the following table (second column, gray-shaded cells). Instructions: If you are entering any negative numbers be sure to include a negative sign (-) in front of those numbers. S1 Quantity Supplied S2 Quantity Supplied |Change in Quantity Supplied Price 3 4 2 b. If production costs were to increase, the quantities supplied at each price would be as shown by the third column of the table ("S, Quantity Supplied"). Use those data to draw supply curve S, using the graph below. Instructions: On the graph below, use your mouse to click and drag supply curve S, as necessary, or you may move the individual points. 5 4 s, 2 1 10 15 20 Quantity supplied c. In the fourth column (gray-shaded cells) of the table in part a, enter the amount by which the quantity supplied at each price changes due to the increase in product costs. (Use positive numbers for increases and negative numbers for decreases.) d. Did the increase in production costs cause a "decrease in supply" or a "decrease in quantity supplied"?

Principles of Economics 2e
2nd Edition
ISBN:9781947172364
Author:Steven A. Greenlaw; David Shapiro
Publisher:Steven A. Greenlaw; David Shapiro
Chapter3: Demand And Supply
Section: Chapter Questions
Problem 53P: Table 3.8 shows information on the demand and supply for bicycles, where the quantities of bicycles...

Related questions
Question
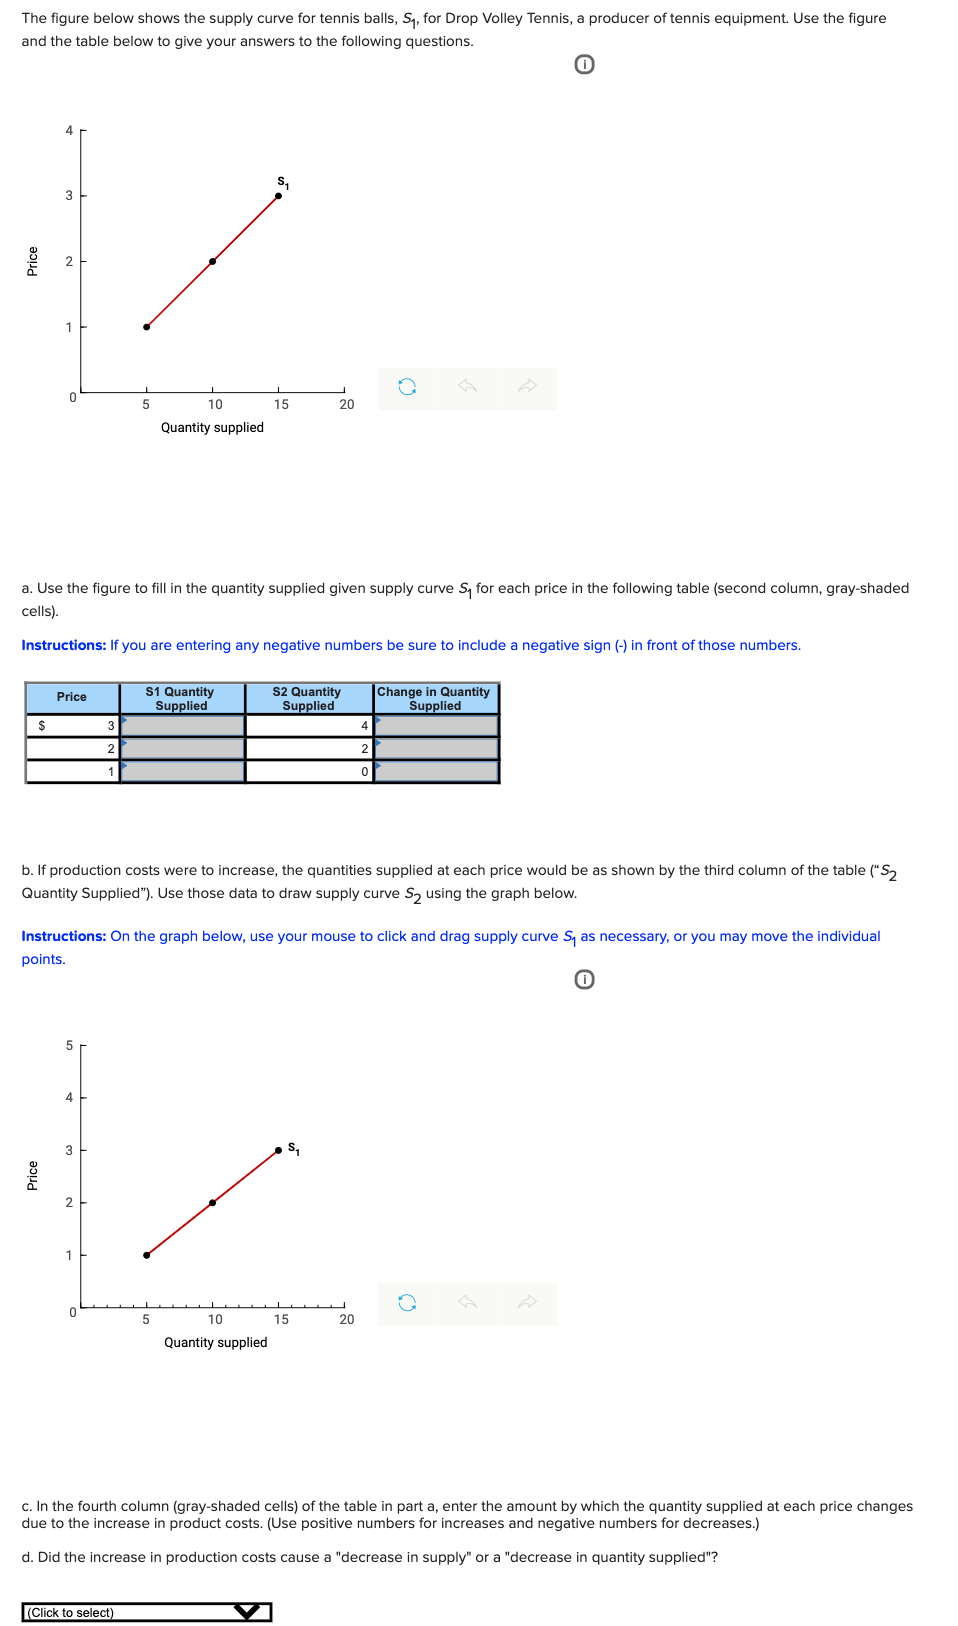
Transcribed Image Text:The figure below shows the supply curve for tennis balls, S, for Drop Volley Tennis, a producer of tennis equipment. Use the figure
and the table below to give your answers to the following questions.
4
1
10
15
20
Quantity supplied
a. Use the figure to fill in the quantity supplied given supply curve S, for each price in the following table (second column, gray-shaded
cells).
Instructions: If you are entering any negative numbers be sure to include a negative sign (-) in front of those numbers.
S1 Quantity
Supplied
S2 Quantity
Supplied
Change in Quantity
Supplied
Price
$
3
4
2
1
b. If production costs were to increase, the quantities supplied at each price would be as shown by the third column of the table ("S,
Quantity Supplied"). Use those data to draw supply curve S, using the graph below.
Instructions: On the graph below, use your mouse to click and drag supply curve S, as necessary, or you may move the individual
points.
5
4
3
s,
1
5
10
15
20
Quantity supplied
c. In the fourth column (gray-shaded cells) of the table in part a, enter the amount by which the quantity supplied at each price changes
due to the increase in product costs. (Use positive numbers for increases and negative numbers for decreases.)
d. Did the increase in production costs cause a "decrease in supply" or a "decrease in quantity supplied"?
(Click to select)
Price
Price
Expert Solution
This question has been solved!
Explore an expertly crafted, step-by-step solution for a thorough understanding of key concepts.

This is a popular solution!

Trending now
This is a popular solution!

Step by step
Solved in 2 steps with 1 images

Knowledge Booster


Learn more about
Need a deep-dive on the concept behind this application? Look no further. Learn more about this topic, economics and related others by exploring similar questions and additional content below.Recommended textbooks for you
Principles of Economics 2e
Economics
ISBN:
9781947172364
Author:
Steven A. Greenlaw; David Shapiro
Publisher:
OpenStax

Principles of Microeconomics
Economics
ISBN:
9781305156050
Author:
N. Gregory Mankiw
Publisher:
Cengage Learning

Microeconomics: Principles & Policy
Economics
ISBN:
9781337794992
Author:
William J. Baumol, Alan S. Blinder, John L. Solow
Publisher:
Cengage Learning
Principles of Economics 2e
Economics
ISBN:
9781947172364
Author:
Steven A. Greenlaw; David Shapiro
Publisher:
OpenStax
Principles of Microeconomics
Economics
ISBN:
9781305156050
Author:
N. Gregory Mankiw
Publisher:
Cengage Learning
Microeconomics: Principles & Policy
Economics
ISBN:
9781337794992
Author:
William J. Baumol, Alan S. Blinder, John L. Solow
Publisher:
Cengage Learning


Exploring Economics
Economics
ISBN:
9781544336329
Author:
Robert L. Sexton
Publisher:
SAGE Publications, Inc
