Consider the market for pens. Suppose that the number of students with an allergy to pencil erasers increases, causing more students to switch from pencils to pens in school. Moreover, the price of plastic, an important input in pen production, has dropped considerably. On the following graph, labeled Scenario 1, indicate the effect these two events have on the demand for and supply of pens. Note: Select and drag one or both of the curves to the desired position. Curves will snap into position, so if you try to move a curve and it snaps back to its original position, just drag it a little farther. 10 PRICE (Dollars perpen) 9 8 Scenario 1 10 3456 Supply Demand QUANTITY (Millions of pens) Scenario 2 Supply wext, complete the following graph, labeled Scenario 2, by shifting the supply and demand curves in the same way that you did on the Scenario 1 graph. Demand 5 QUANTITY (Millions of pens) 8 1 9 10 Demand 1 Supply Demand ? Supply ? Compare both the Scenario 1 and Scenario 2 graphs. Notice that after completing both graphs, you can now see a difference between them that wasn't apparent before the shifts because each graph indicates different magnitudes for the supply and demand shifts in the market for pens.
Consider the market for pens. Suppose that the number of students with an allergy to pencil erasers increases, causing more students to switch from pencils to pens in school. Moreover, the price of plastic, an important input in pen production, has dropped considerably. On the following graph, labeled Scenario 1, indicate the effect these two events have on the demand for and supply of pens. Note: Select and drag one or both of the curves to the desired position. Curves will snap into position, so if you try to move a curve and it snaps back to its original position, just drag it a little farther. 10 PRICE (Dollars perpen) 9 8 Scenario 1 10 3456 Supply Demand QUANTITY (Millions of pens) Scenario 2 Supply wext, complete the following graph, labeled Scenario 2, by shifting the supply and demand curves in the same way that you did on the Scenario 1 graph. Demand 5 QUANTITY (Millions of pens) 8 1 9 10 Demand 1 Supply Demand ? Supply ? Compare both the Scenario 1 and Scenario 2 graphs. Notice that after completing both graphs, you can now see a difference between them that wasn't apparent before the shifts because each graph indicates different magnitudes for the supply and demand shifts in the market for pens.

Chapter1: Making Economics Decisions
Section: Chapter Questions
Problem 1QTC

Related questions
Question
Not graded HW question
Transcribed Image Text:Homework (Ln U4)
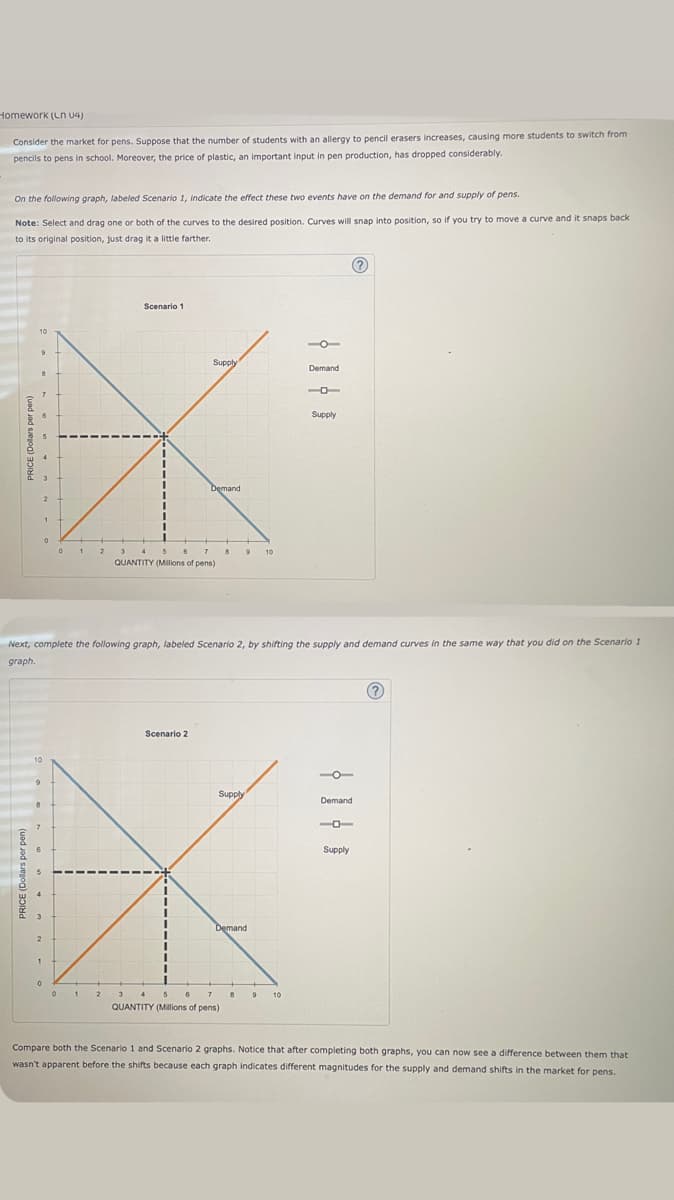
Consider the market for pens. Suppose that the number of students with an allergy to pencil erasers increases, causing more students to switch from
pencils to pens in school. Moreover, the price of plastic, an important input in pen production, has dropped considerably.
On the following graph, labeled Scenario 1, indicate the effect these two events have on the demand for and supply of pens.
Note: Select and drag one or both of the curves to the desired position. Curves will snap into position, so if you try to move a curve and it snaps back
to its original position, just drag it a little farther.
10
Scenario 1
0
Supply
Demand
3 4 5
6
7
QUANTITY (Millions of pens)
Scenario 2
Next, complete the following graph, labeled Scenario 2, by shifting the supply and demand curves in the same way that you did on the Scenario 1
graph.
Supply
Demand
QUANTITY (Millions of pens)
10
9
Demand
10
-
Supply
10
Demand
?
Supply
(?)
Compare both the Scenario 1 and Scenario 2 graphs. Notice that after completing both graphs, you can now see a difference between them that
wasn't apparent before the shifts because each graph indicates different magnitudes for the supply and demand shifts in the market for pens.
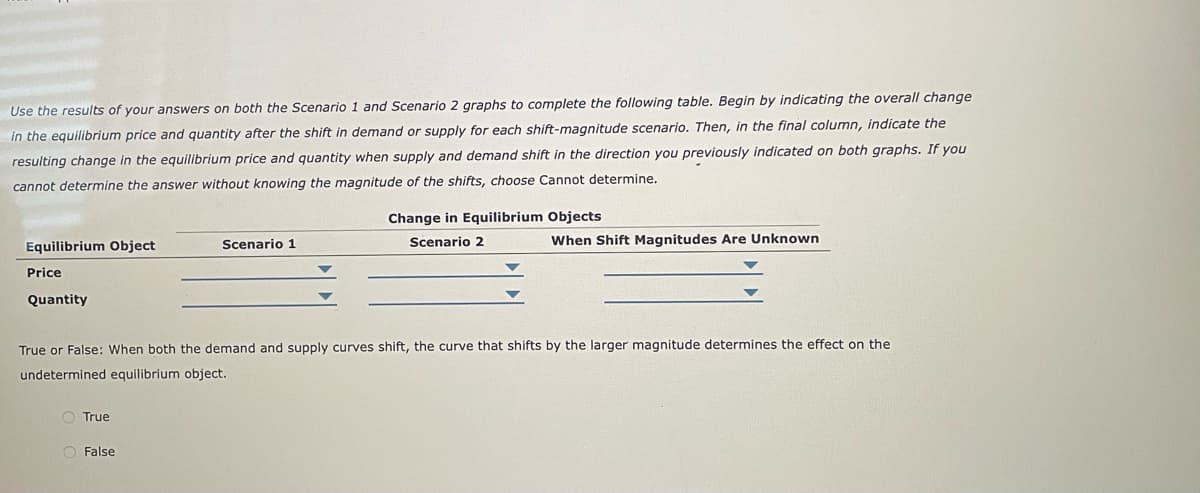
Transcribed Image Text:Use the results of your answers on both the Scenario 1 and Scenario 2 graphs to complete the following table. Begin by indicating the overall change
in the equilibrium price and quantity after the shift in demand or supply for each shift-magnitude scenario. Then, in the final column, indicate the
resulting change in the equilibrium price and quantity when supply and demand shift in the direction you previously indicated on both graphs. If you
cannot determine the answer without knowing the magnitude of the shifts, choose Cannot determine.
Equilibrium Object
Price
Quantity
True
Scenario 1
O False
Change in Equilibrium Objects
Scenario 2
True or False: When both the demand and supply curves shift, the curve that shifts by the larger magnitude determines the effect on the
undetermined equilibrium object.
When Shift Magnitudes Are Unknown
Expert Solution
This question has been solved!
Explore an expertly crafted, step-by-step solution for a thorough understanding of key concepts.

Step by step
Solved in 6 steps with 2 images

Knowledge Booster


Learn more about
Need a deep-dive on the concept behind this application? Look no further. Learn more about this topic, economics and related others by exploring similar questions and additional content below.Recommended textbooks for you

Principles of Economics (12th Edition)
Economics
ISBN:
9780134078779
Author:
Karl E. Case, Ray C. Fair, Sharon E. Oster
Publisher:
PEARSON

Engineering Economy (17th Edition)
Economics
ISBN:
9780134870069
Author:
William G. Sullivan, Elin M. Wicks, C. Patrick Koelling
Publisher:
PEARSON
Principles of Economics (12th Edition)
Economics
ISBN:
9780134078779
Author:
Karl E. Case, Ray C. Fair, Sharon E. Oster
Publisher:
PEARSON
Engineering Economy (17th Edition)
Economics
ISBN:
9780134870069
Author:
William G. Sullivan, Elin M. Wicks, C. Patrick Koelling
Publisher:
PEARSON

Principles of Economics (MindTap Course List)
Economics
ISBN:
9781305585126
Author:
N. Gregory Mankiw
Publisher:
Cengage Learning

Managerial Economics: A Problem Solving Approach
Economics
ISBN:
9781337106665
Author:
Luke M. Froeb, Brian T. McCann, Michael R. Ward, Mike Shor
Publisher:
Cengage Learning

Managerial Economics & Business Strategy (Mcgraw-…
Economics
ISBN:
9781259290619
Author:
Michael Baye, Jeff Prince
Publisher:
McGraw-Hill Education