AB 6 I Osmosis and Diffusion Table 1. Change in Mass of Carrot Slices. 0 min 15 min 30 min Sucrose Concentration 45 min 60 min Mass Initial Change 0'14 Total Total Change lil4014 1-48 0.181.54 Total Change Total Change 1.1니 1.60 013 190.04 0-99 0% 1.0 1'160.16015-0.85 5% 1.3 0.24152 6-22 0190.98 018 1.16 10.06 1:22-0.08 190.39 0.89 1'2니 | 0'1니 |1.12 |0.0 2 10% 1.24 014 11310:01 20% 1.3 1'31 0.01 1.15 0.050.99-0.11 30% 1.200.1 40% 6.98 -0.120.98-0.12 0'86 0.06 0•69-0110j0 -o:0.7-0.13 60% L9.0 Each change in mass is the difference between the current total mass and the initial mass (can be +/-). ' C. Using the graph paper on the next page, construct a line graph of the data from Table 1. The y-axis should be Change in Mass, and the x-axis should be labeled Time in Min. For 0 time, all Change in Mass would be 0. Put a title on your graph. Plot the data for all seven carrot slices on one graph, and label the lines appropriately. d. In which carrot slices did osmosis occur? Explain! In which % sucrose solution did the carrot slice have the greatest change in mass? Explain why. e. f. Refer to your graph. How does the slope of a segment of a curve relate to the rate of osmosis? 8. Referring to the data collected, estimate the % sucrose content within carrots. (Hint: Isotonic!) h. How do these results fit with your original hypothesis before beginning the experiment? Osmosis and Diffusion LAB 6 o14 043 0.2 -0.2 -0:03 014 15 30 45 57 Time o1니 চ
AB 6 I Osmosis and Diffusion Table 1. Change in Mass of Carrot Slices. 0 min 15 min 30 min Sucrose Concentration 45 min 60 min Mass Initial Change 0'14 Total Total Change lil4014 1-48 0.181.54 Total Change Total Change 1.1니 1.60 013 190.04 0-99 0% 1.0 1'160.16015-0.85 5% 1.3 0.24152 6-22 0190.98 018 1.16 10.06 1:22-0.08 190.39 0.89 1'2니 | 0'1니 |1.12 |0.0 2 10% 1.24 014 11310:01 20% 1.3 1'31 0.01 1.15 0.050.99-0.11 30% 1.200.1 40% 6.98 -0.120.98-0.12 0'86 0.06 0•69-0110j0 -o:0.7-0.13 60% L9.0 Each change in mass is the difference between the current total mass and the initial mass (can be +/-). ' C. Using the graph paper on the next page, construct a line graph of the data from Table 1. The y-axis should be Change in Mass, and the x-axis should be labeled Time in Min. For 0 time, all Change in Mass would be 0. Put a title on your graph. Plot the data for all seven carrot slices on one graph, and label the lines appropriately. d. In which carrot slices did osmosis occur? Explain! In which % sucrose solution did the carrot slice have the greatest change in mass? Explain why. e. f. Refer to your graph. How does the slope of a segment of a curve relate to the rate of osmosis? 8. Referring to the data collected, estimate the % sucrose content within carrots. (Hint: Isotonic!) h. How do these results fit with your original hypothesis before beginning the experiment? Osmosis and Diffusion LAB 6 o14 043 0.2 -0.2 -0:03 014 15 30 45 57 Time o1니 চ

Biology: The Dynamic Science (MindTap Course List)
4th Edition
ISBN:9781305389892
Author:Peter J. Russell, Paul E. Hertz, Beverly McMillan
Publisher:Peter J. Russell, Paul E. Hertz, Beverly McMillan
Chapter5: Membranes And Transport
Section: Chapter Questions
Problem 10TYK: Using the principle of diffusion, a dialysis machine removes waste solutes from a patients blood....

Related questions

Question
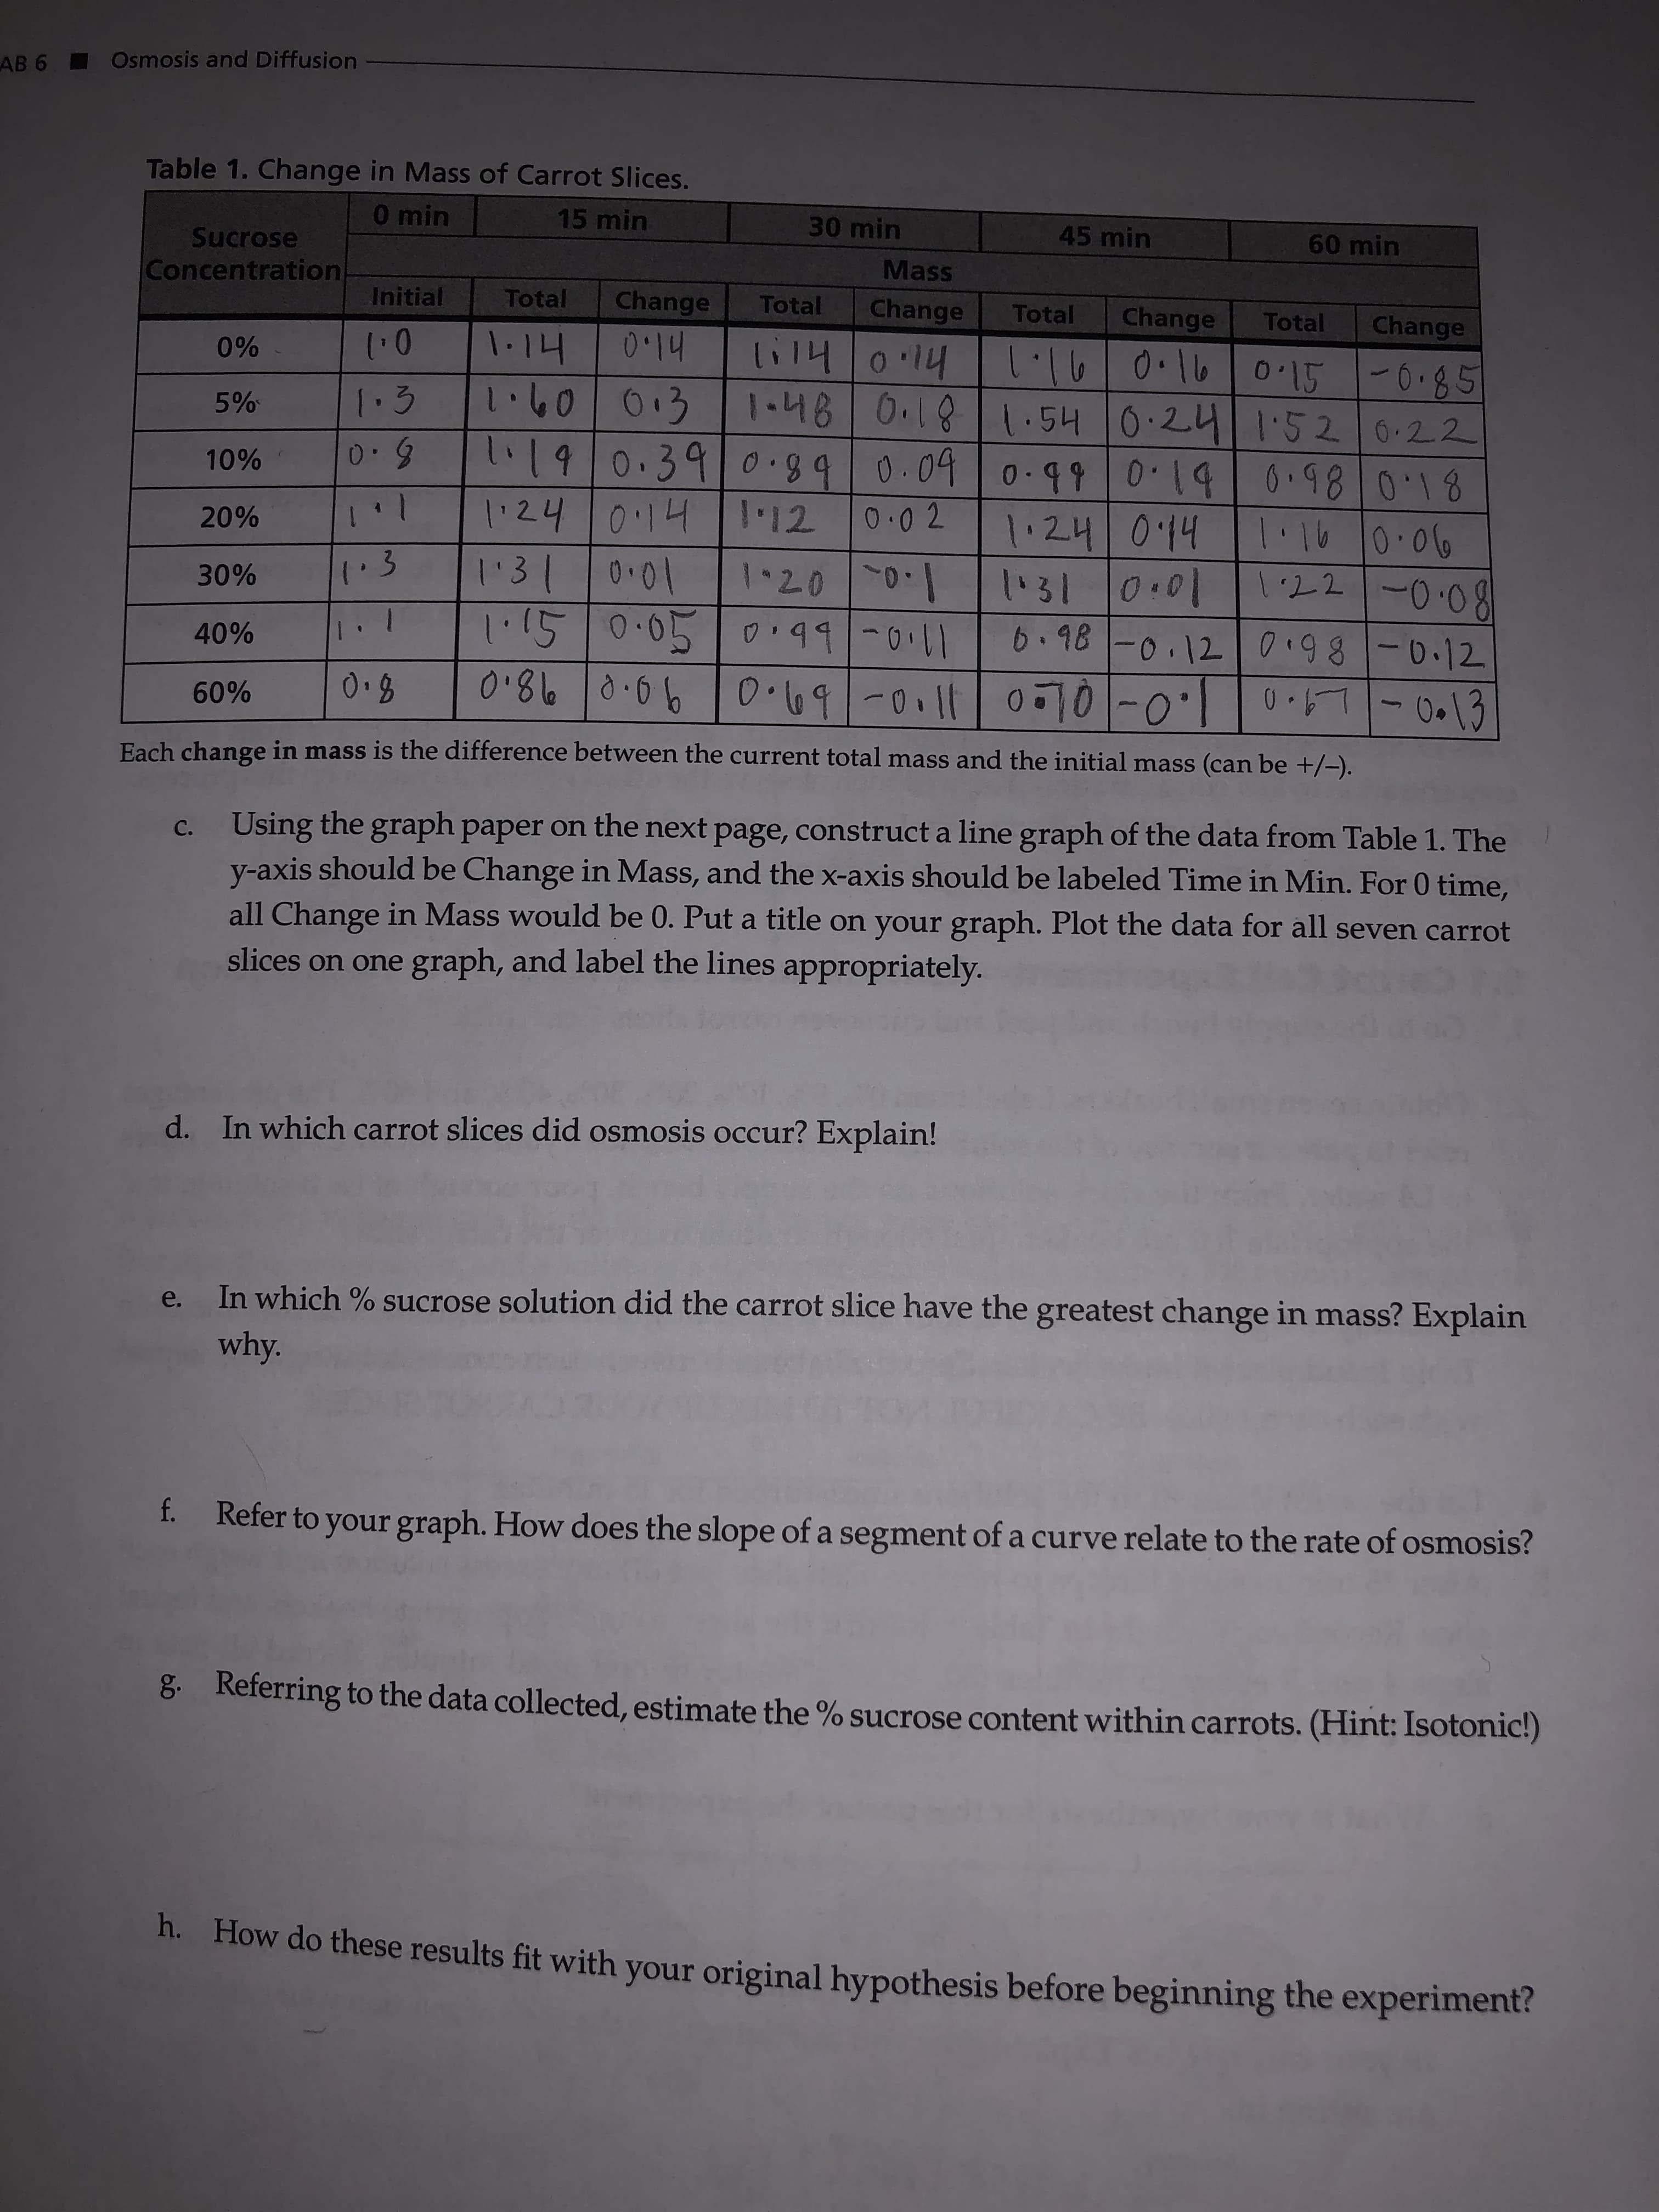
Can you assist me in answerig questions a, b, and c with the given data and graph provided, please?
Transcribed Image Text:AB 6 I Osmosis and Diffusion
Table 1. Change in Mass of Carrot Slices.
0 min
15 min
30 min
Sucrose
Concentration
45 min
60 min
Mass
Initial
Change
0'14
Total
Total
Change
lil4014
1-48 0.181.54
Total
Change
Total
Change
1.1니
1.60 013
190.04 0-99
0%
1.0
1'160.16015-0.85
5%
1.3
0.24152 6-22
0190.98 018
1.16 10.06
1:22-0.08
190.39 0.89
1'2니 | 0'1니 |1.12 |0.0 2
10%
1.24 014
11310:01
20%
1.3
1'31
0.01
1.15 0.050.99-0.11
30%
1.200.1
40%
6.98 -0.120.98-0.12
0'86 0.06 0•69-0110j0 -o:0.7-0.13
60%
L9.0
Each change in mass is the difference between the current total mass and the initial mass (can be +/-).
'
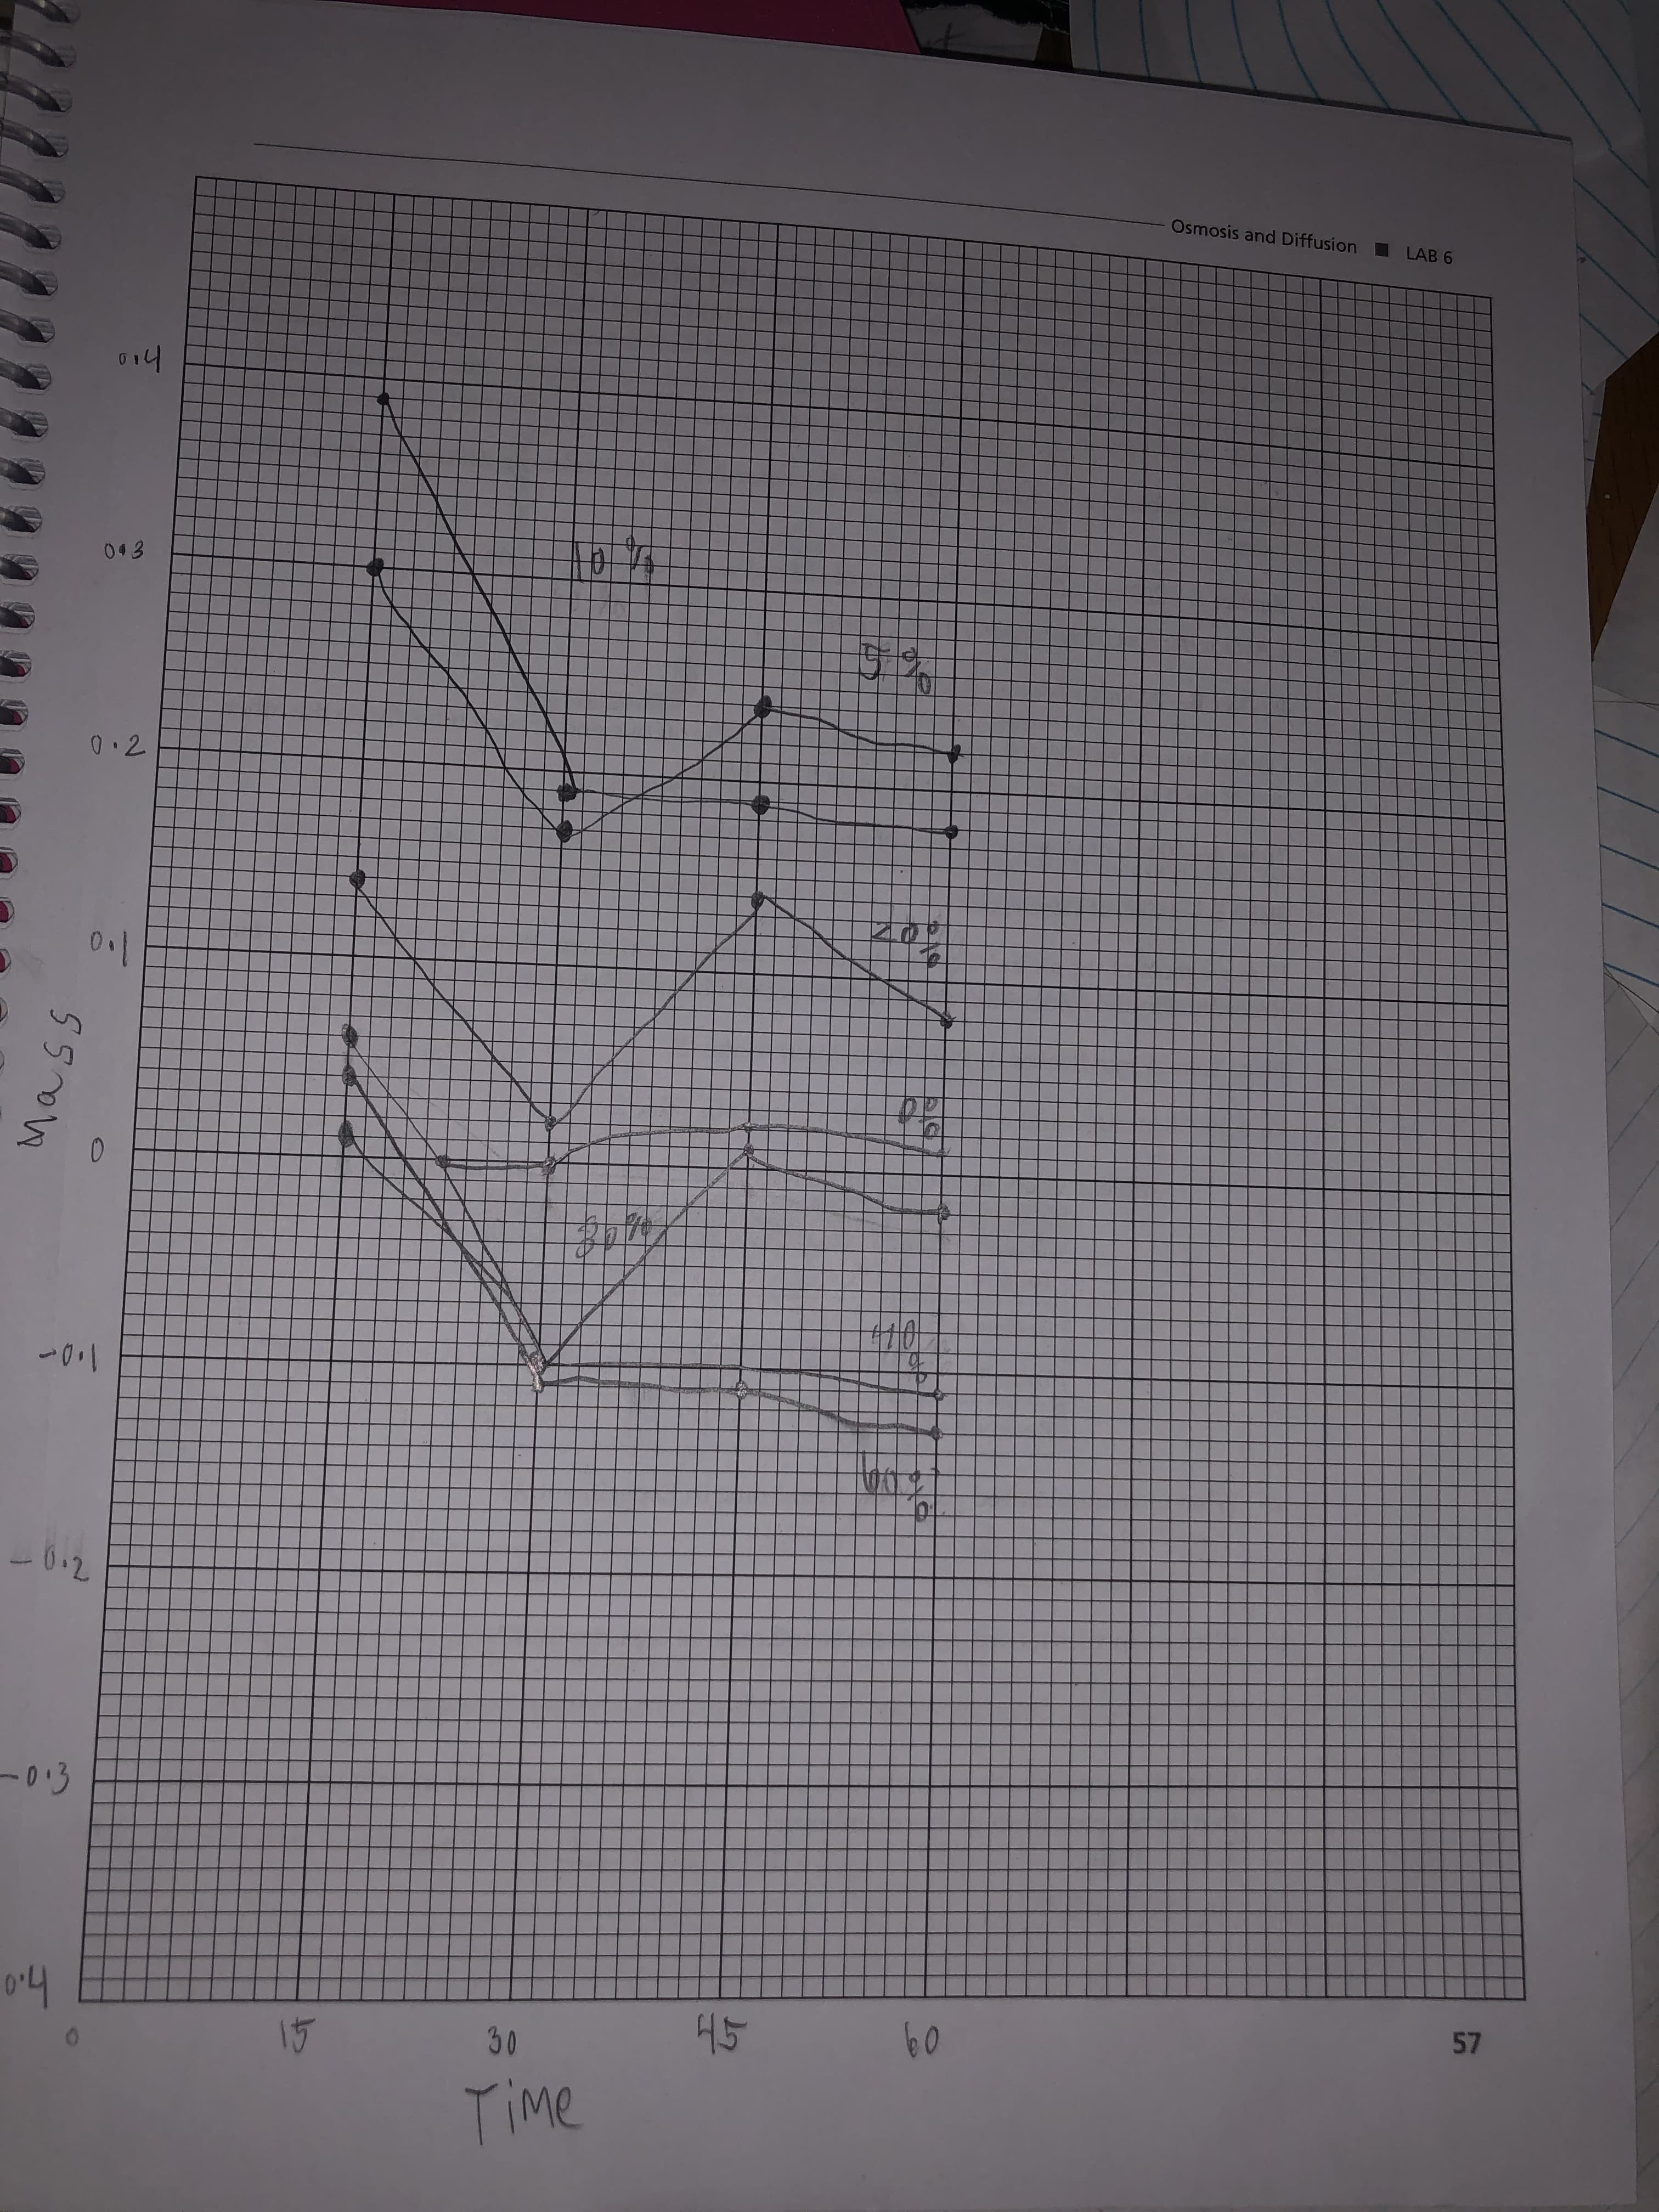
C.
Using the graph paper on the next page, construct a line graph of the data from Table 1. The
y-axis should be Change in Mass, and the x-axis should be labeled Time in Min. For 0 time,
all Change in Mass would be 0. Put a title on your graph. Plot the data for all seven carrot
slices on one graph, and label the lines appropriately.
d. In which carrot slices did osmosis occur? Explain!
In which % sucrose solution did the carrot slice have the greatest change in mass? Explain
why.
e.
f. Refer to your graph. How does the slope of a segment of a curve relate to the rate of osmosis?
8. Referring to the data collected, estimate the % sucrose content within carrots. (Hint: Isotonic!)
h. How do these results fit with your original hypothesis before beginning the experiment?
Transcribed Image Text:Osmosis and Diffusion
LAB 6
o14
043
0.2
-0.2
-0:03
014
15
30
45
57
Time
o1니
চ
Expert Solution
This question has been solved!
Explore an expertly crafted, step-by-step solution for a thorough understanding of key concepts.

This is a popular solution!

Trending now
This is a popular solution!

Step by step
Solved in 3 steps with 1 images

Knowledge Booster


Learn more about
Need a deep-dive on the concept behind this application? Look no further. Learn more about this topic, biology and related others by exploring similar questions and additional content below.Recommended textbooks for you
Biology: The Dynamic Science (MindTap Course List)
Biology
ISBN:
9781305389892
Author:
Peter J. Russell, Paul E. Hertz, Beverly McMillan
Publisher:
Cengage Learning

Biology 2e
Biology
ISBN:
9781947172517
Author:
Matthew Douglas, Jung Choi, Mary Ann Clark
Publisher:
OpenStax

Biology: The Unity and Diversity of Life (MindTap…
Biology
ISBN:
9781337408332
Author:
Cecie Starr, Ralph Taggart, Christine Evers, Lisa Starr
Publisher:
Cengage Learning
Biology: The Dynamic Science (MindTap Course List)
Biology
ISBN:
9781305389892
Author:
Peter J. Russell, Paul E. Hertz, Beverly McMillan
Publisher:
Cengage Learning
Biology 2e
Biology
ISBN:
9781947172517
Author:
Matthew Douglas, Jung Choi, Mary Ann Clark
Publisher:
OpenStax
Biology: The Unity and Diversity of Life (MindTap…
Biology
ISBN:
9781337408332
Author:
Cecie Starr, Ralph Taggart, Christine Evers, Lisa Starr
Publisher:
Cengage Learning

Biology Today and Tomorrow without Physiology (Mi…
Biology
ISBN:
9781305117396
Author:
Cecie Starr, Christine Evers, Lisa Starr
Publisher:
Cengage Learning