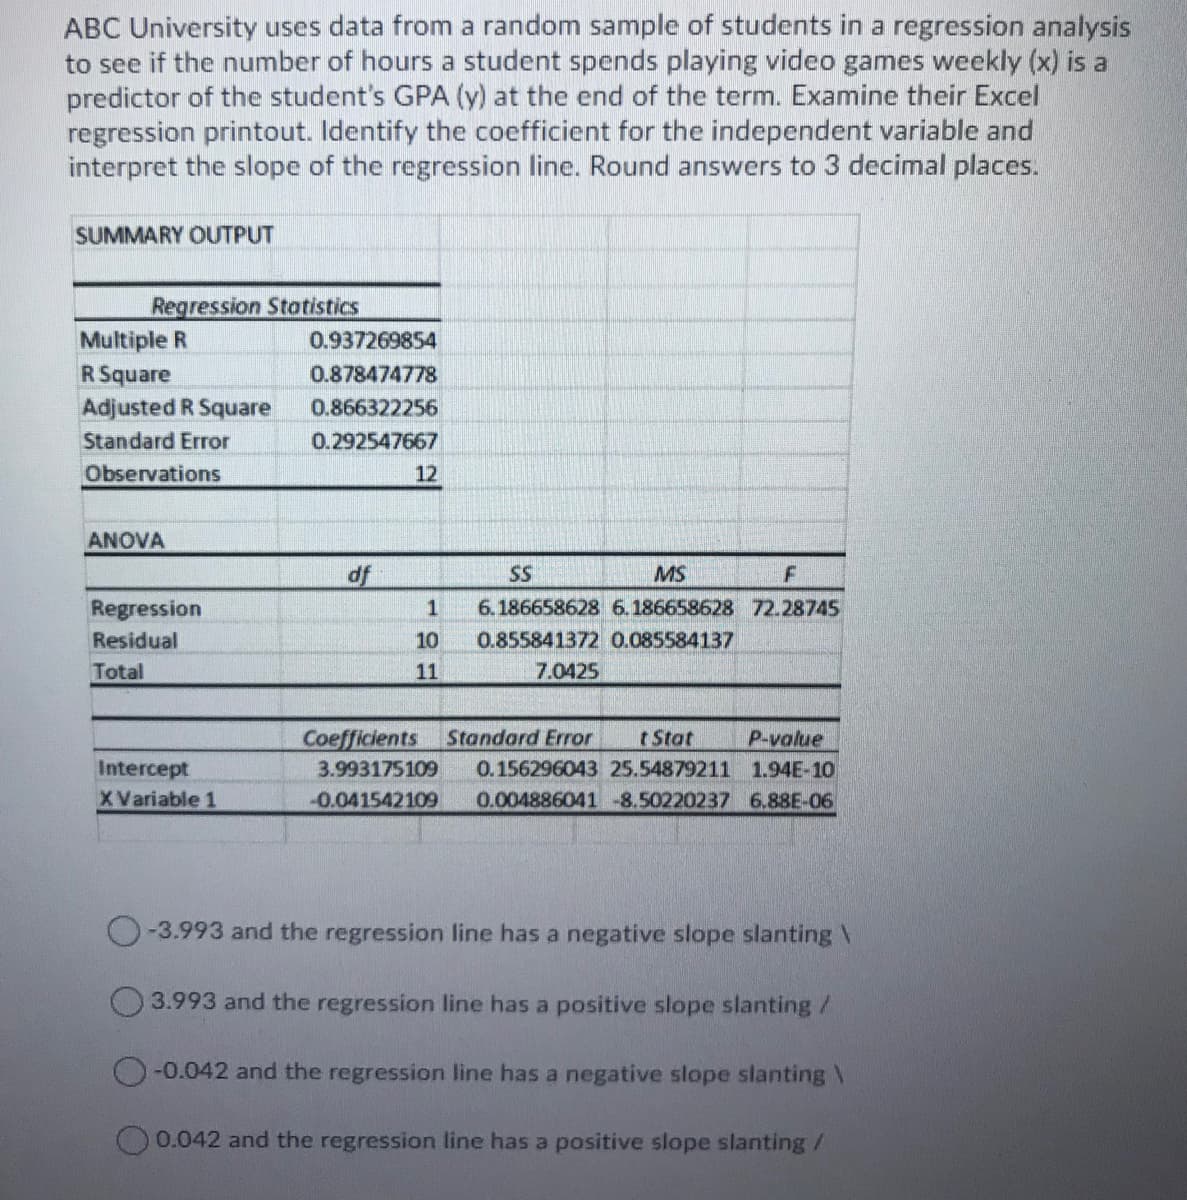
ABC University uses data from a random sample of students in a regression analysis to see if the number of hours a student spends playing video games weekly (x) is a predictor of the student's GPA (y) at the end of the term. Examine their Excel regression printout. Identify the coefficient for the independent variable and interpret the slope of the regression line. Round answers to 3 decimal places. SUMMARY OUTPUT Regression Statistics Multiple R 0.937269854 R Square 0.878474778 Adjusted R Square 0.866322256 Standard Error 0.292547667 Observations 12 ANOVA df SS MS Regression 6.186658628 6.186658628 72.28745 Residual 10 0.855841372 0.085584137 Total 11 7.0425 Coefficients Standard Error t Stat P-value 0.156296043 25.54879211 1.94E-10 0.004886041 -8.50220237 6.88E-06 Intercept 3.993175109 XVariable 1 -0.041542109 O-3.993 and the regression line has a negative slope slanting \ 3.993 and the regression line has a positive slope slanting /


Correlation
Correlation defines a relationship between two independent variables. It tells the degree to which variables move in relation to each other. When two sets of data are related to each other, there is a correlation between them.
Linear Correlation
A correlation is used to determine the relationships between numerical and categorical variables. In other words, it is an indicator of how things are connected to one another. The correlation analysis is the study of how variables are related.
Regression Analysis
Regression analysis is a statistical method in which it estimates the relationship between a dependent variable and one or more independent variable. In simple terms dependent variable is called as outcome variable and independent variable is called as predictors. Regression analysis is one of the methods to find the trends in data. The independent variable used in Regression analysis is named Predictor variable. It offers data of an associated dependent variable regarding a particular outcome.
Given :
Here, Excel regression printout is given.
We have to identify the coefficient for the independent variable and interpret the slope of the regression line.

Step by step
Solved in 3 steps


