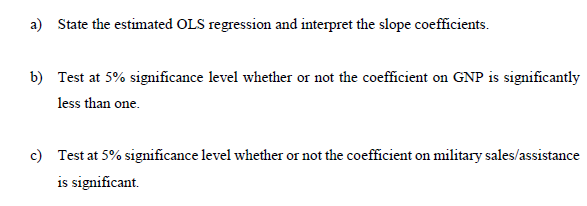
a) State the estimated OLS regression and interpret the slope coefficients. b) Test at 5% significance level whether or not the coefficient on GNP is significantly less than one. c) Test at 5% significance level whether or not the coefficient on military sales/assistance is significant.
a) State the estimated OLS regression and interpret the slope coefficients. b) Test at 5% significance level whether or not the coefficient on GNP is significantly less than one. c) Test at 5% significance level whether or not the coefficient on military sales/assistance is significant.

Linear Algebra: A Modern Introduction
4th Edition
ISBN:9781285463247
Author:David Poole
Publisher:David Poole
Chapter7: Distance And Approximation
Section7.3: Least Squares Approximation
Problem 29EQ

Related questions
Question
Transcribed Image Text:a) State the estimated OLS regression and interpret the slope coefficients.
b) Test at 5% significance level whether or not the coefficient on GNP is significantly
less than one.
c) Test at 5% significance level whether or not the coefficient on military sales/assistance
is significant.
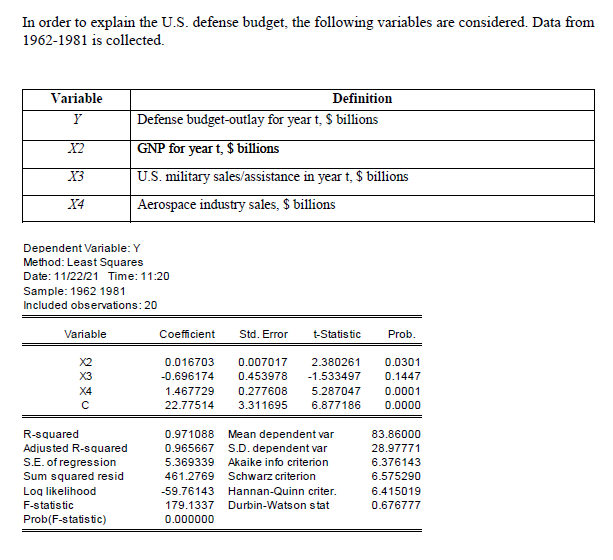
Transcribed Image Text:In order to explain the U.S. defense budget, the following variables are considered. Data from
1962-1981 is collected.
Variable
Definition
Y
Defense budget-outlay for year t, $ billions
X2
GNP for year t, $ billions
X3
U.S. military sales/assistance in year t, $ billions
X4
Aerospace industry sales, $ billions
Dependent Variable: Y
Method: Least Squares
Date: 11/22/21 Time: 11:20
Sample: 1962 1981
Included observations: 20
Variable
Coefficient
Std. Error
t-Statistic
Prob.
X2
0.016703
0.007017
2.380261
0.0301
X3
-0.696174
0.453978
-1.533497
0.1447
X4
1.467729
0.277608
5.287047
0.0001
22.77514
3.311695
6.877186
0.0000
R-squared
0.971088
Mean dependent var
83.86000
Adjusted R-squared
0.965667
S.D. dependent var
28.97771
S.E. of regression
Sum squared resid
5.369339
Akaike info criterion
6.376143
461.2769
Schwarz criterion
6.575290
Log likelihood
-59.76143
Hannan-Quinn criter.
6.415019
F-statistic
179.1337
Durbin-Watson stat
0.676777
Prob(F-statistic)
0.000000
Expert Solution
This question has been solved!
Explore an expertly crafted, step-by-step solution for a thorough understanding of key concepts.

Step by step
Solved in 2 steps

Recommended textbooks for you
Linear Algebra: A Modern Introduction
Algebra
ISBN:
9781285463247
Author:
David Poole
Publisher:
Cengage Learning
Linear Algebra: A Modern Introduction
Algebra
ISBN:
9781285463247
Author:
David Poole
Publisher:
Cengage Learning