sed on the data shown below, use software such as Excel to calculate the slope and intercept and determine the regression line. y 2 22.4 3 19.35 4 22.3 21.15 21.9 20.35 8. 21.6 19.95 10 20 Round each value to two decimal places.
sed on the data shown below, use software such as Excel to calculate the slope and intercept and determine the regression line. y 2 22.4 3 19.35 4 22.3 21.15 21.9 20.35 8. 21.6 19.95 10 20 Round each value to two decimal places.

Glencoe Algebra 1, Student Edition, 9780079039897, 0079039898, 2018
18th Edition
ISBN:9780079039897
Author:Carter
Publisher:Carter
Chapter4: Equations Of Linear Functions
Section: Chapter Questions
Problem 6SGR

Related questions
Question
100%
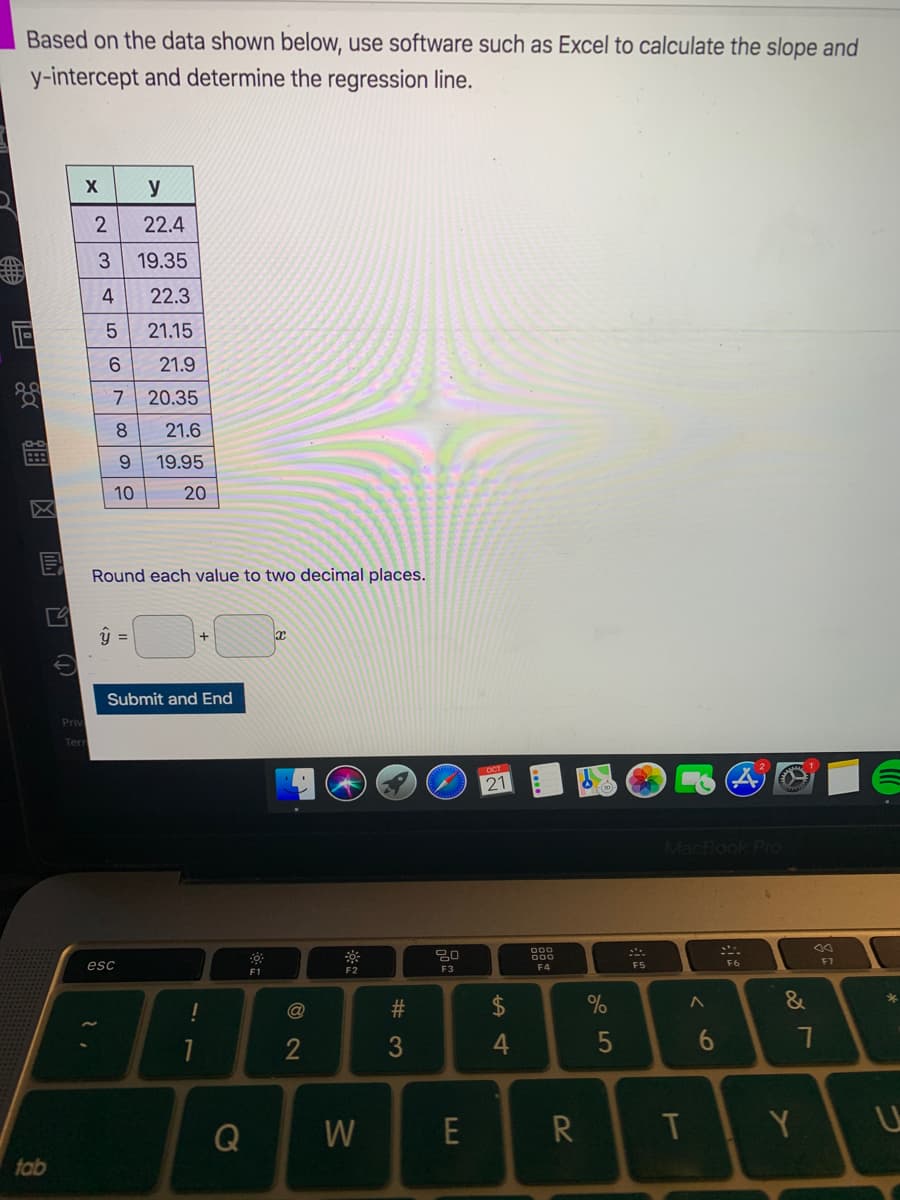
Transcribed Image Text:Based on the data shown below, use software such as Excel to calculate the slope and
y-intercept and determine the regression line.
y
22.4
3 19.35
4
22.3
21.15
21.9
7
20.35
8.
21.6
19.95
10
20
Round each value to two decimal places.
Submit and End
Priv
Terr
OCT
21
MacBook Pro
000
esc
F5
F6
F7
F3
F4
F1
2$
&
4
5
6
Q
W
T
Y
tab
RI
# 3
Expert Solution
This question has been solved!
Explore an expertly crafted, step-by-step solution for a thorough understanding of key concepts.

This is a popular solution!

Trending now
This is a popular solution!

Step by step
Solved in 3 steps with 3 images

Recommended textbooks for you
Glencoe Algebra 1, Student Edition, 9780079039897…
Algebra
ISBN:
9780079039897
Author:
Carter
Publisher:
McGraw Hill

Algebra & Trigonometry with Analytic Geometry
Algebra
ISBN:
9781133382119
Author:
Swokowski
Publisher:
Cengage

Functions and Change: A Modeling Approach to Coll…
Algebra
ISBN:
9781337111348
Author:
Bruce Crauder, Benny Evans, Alan Noell
Publisher:
Cengage Learning
Glencoe Algebra 1, Student Edition, 9780079039897…
Algebra
ISBN:
9780079039897
Author:
Carter
Publisher:
McGraw Hill
Algebra & Trigonometry with Analytic Geometry
Algebra
ISBN:
9781133382119
Author:
Swokowski
Publisher:
Cengage
Functions and Change: A Modeling Approach to Coll…
Algebra
ISBN:
9781337111348
Author:
Bruce Crauder, Benny Evans, Alan Noell
Publisher:
Cengage Learning