Absorbance 2 1.8 1.6 1.4 1.2 1 0.8 0.6 0.4 0.2 0 Acetic anhydride decay at 250 nm • D20 H20 2000 3000 Time (s) 1000 0 Line on figure A Line on figure B Line on figure C In (Absorbance) (A) 4000 1.000 0.500 0.000 -0.500 -1.000 -1.500 -2.000 -2.500 -3.000 -3.500 -4.000 0 1/Absorbance 40.00 35.00 30.00 25.00 20.00 15.00 10.00 5.00 0.00 5000 0 1000 Acetic anhydride decay at 250 nm • D20 • H2O Acetic anhydride decay at 250 nm • D20 H2O 2000 3000 Time (s) y=-0.000788x +0.714117 4000 5000 y = -0.00203x + 0.44013 1000 2000 3000 Time (s) 4000 5000 first order second order zero order
Absorbance 2 1.8 1.6 1.4 1.2 1 0.8 0.6 0.4 0.2 0 Acetic anhydride decay at 250 nm • D20 H20 2000 3000 Time (s) 1000 0 Line on figure A Line on figure B Line on figure C In (Absorbance) (A) 4000 1.000 0.500 0.000 -0.500 -1.000 -1.500 -2.000 -2.500 -3.000 -3.500 -4.000 0 1/Absorbance 40.00 35.00 30.00 25.00 20.00 15.00 10.00 5.00 0.00 5000 0 1000 Acetic anhydride decay at 250 nm • D20 • H2O Acetic anhydride decay at 250 nm • D20 H2O 2000 3000 Time (s) y=-0.000788x +0.714117 4000 5000 y = -0.00203x + 0.44013 1000 2000 3000 Time (s) 4000 5000 first order second order zero order

Principles of Instrumental Analysis
7th Edition
ISBN:9781305577213
Author:Douglas A. Skoog, F. James Holler, Stanley R. Crouch
Publisher:Douglas A. Skoog, F. James Holler, Stanley R. Crouch
Chapter17: Applications Of Infrared Spectrometry
Section: Chapter Questions
Problem 17.6QAP

Related questions
Question
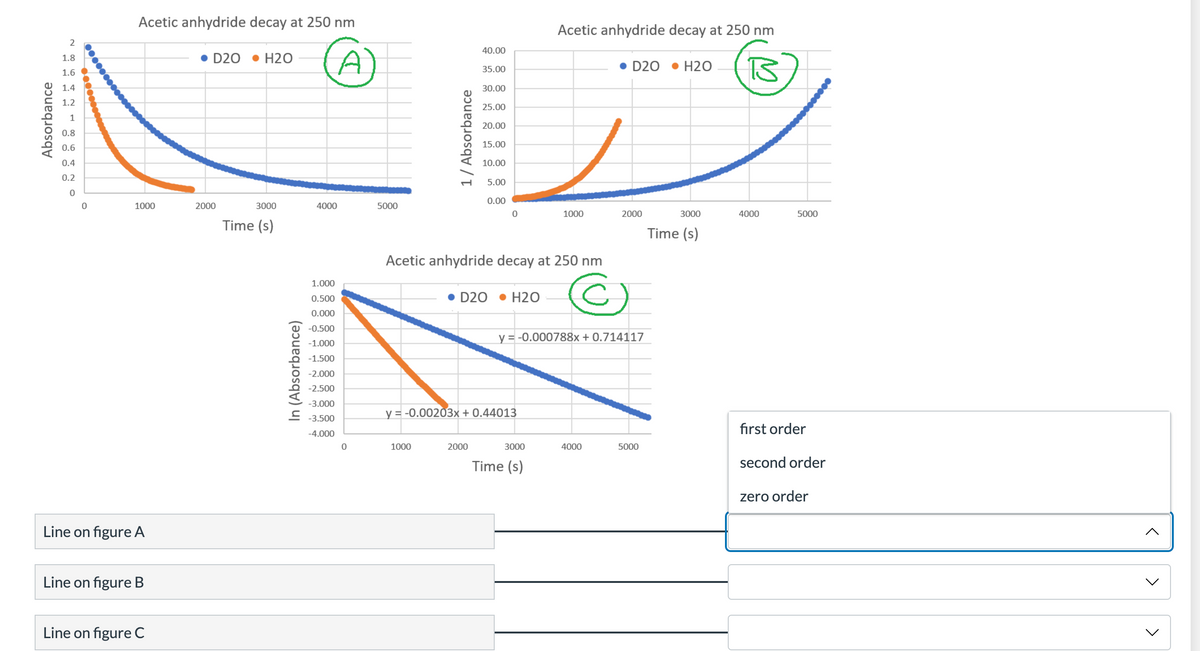
The raw data is plotted in figure A. Then I transformed the absorbance data to make figures B and C. A line (instead of a curve) on each plot would predict what reaction order for the rate law?
Transcribed Image Text:Absorbance
2
1.8
1.6
1.4
1.2
1
0.8
0.6
0.4
0.2
0
Acetic anhydride decay at 250 nm
• D20 • H2O
3000
Time (s)
.............
1000
0
Line on figure A
Line on figure B
Line on figure C
2000
In (Absorbance)
(A)
4000
1.000
0.500
0.000
-0.500
-1.000
-1.500
-2.000
-2.500
-3.000
-3.500
-4.000
0
40.00
35.00
30.00
25.00
20.00
15.00
10.00
5.00
0.00
5000
0
1000
Acetic anhydride decay at 250 nm
D20 H2O
1 / Absorbance
Acetic anhydride decay at 250 nm
D20 H20
डि
3000
Time (s)
y = -0.00203x + 0.44013
1000
2000
3000
Time (s)
2000
©
y = -0.000788x +0.714117
4000
5000
4000
5000
************000
first order
second order
zero order
<
Expert Solution
This question has been solved!
Explore an expertly crafted, step-by-step solution for a thorough understanding of key concepts.

Step by step
Solved in 2 steps

Knowledge Booster


Learn more about
Need a deep-dive on the concept behind this application? Look no further. Learn more about this topic, chemistry and related others by exploring similar questions and additional content below.Recommended textbooks for you
Principles of Instrumental Analysis
Chemistry
ISBN:
9781305577213
Author:
Douglas A. Skoog, F. James Holler, Stanley R. Crouch
Publisher:
Cengage Learning

Principles of Instrumental Analysis
Chemistry
ISBN:
9781305577213
Author:
Douglas A. Skoog, F. James Holler, Stanley R. Crouch
Publisher:
Cengage Learning