According to a study conducted by a statistical organization, the proportion of people who are satisfied with the way things are going in their lives is 0.88. Suppose that a random sample of 100 people is obtained. Complete parts (a) through (e) below. (a) Suppose the random sample of 100 people is asked, "Are you satisfied with the way things are going in your life?" Is the response to this question qualitative or quantitative? Explain. A. The response is qualitative because the responses can be classified based on the characteristic of being satisfied or not. B. The response is quantitative because the number of people satisfied can be counted. C. The response is quantitative because the responses can be classified based on the characteristic of being satisfied or not. D. The response is qualitative because the number of people satisfied can be counted. (b) Explain why the sample proportion, p, is a random variable. What is the source of the variability? A. The sample proportion p is a random variable because the value of p represents a random person included in the sample. The variability is due to the fact that people may not be responding to the question truthfully. B. The sample proportion p is a random variable because the value of p varies from sample to sample. The variability is due to the fact that different people feel differently regarding their satisfaction. C. The sample proportion p is a random variable because the value of p represents a random person included in the sample. The variability is due to the fact that different people feel differently regarding their satisfaction. D. The sample proportion p is a random variable because the value of p varies from sample to sample. The variability is due to the fact that people may not be responding to the question truthfully. (c) Describe the sampling distribution of p, the proportion of people who are satisfied with the way things are going in their life. Be sure to verify the model requirements. Since the sample size is ▼ no less no more than 5% of the population size and np(1−p)=nothing≥10, the distribution of p is ▼ skewed left uniform skewed right approximately normal with μp=nothing and σp=nothing. (Round to three decimal places as needed.)
According to a study conducted by a statistical organization, the proportion of people who are satisfied with the way things are going in their lives is 0.88. Suppose that a random sample of 100 people is obtained. Complete parts (a) through (e) below. (a) Suppose the random sample of 100 people is asked, "Are you satisfied with the way things are going in your life?" Is the response to this question qualitative or quantitative? Explain. A. The response is qualitative because the responses can be classified based on the characteristic of being satisfied or not. B. The response is quantitative because the number of people satisfied can be counted. C. The response is quantitative because the responses can be classified based on the characteristic of being satisfied or not. D. The response is qualitative because the number of people satisfied can be counted. (b) Explain why the sample proportion, p, is a random variable. What is the source of the variability? A. The sample proportion p is a random variable because the value of p represents a random person included in the sample. The variability is due to the fact that people may not be responding to the question truthfully. B. The sample proportion p is a random variable because the value of p varies from sample to sample. The variability is due to the fact that different people feel differently regarding their satisfaction. C. The sample proportion p is a random variable because the value of p represents a random person included in the sample. The variability is due to the fact that different people feel differently regarding their satisfaction. D. The sample proportion p is a random variable because the value of p varies from sample to sample. The variability is due to the fact that people may not be responding to the question truthfully. (c) Describe the sampling distribution of p, the proportion of people who are satisfied with the way things are going in their life. Be sure to verify the model requirements. Since the sample size is ▼ no less no more than 5% of the population size and np(1−p)=nothing≥10, the distribution of p is ▼ skewed left uniform skewed right approximately normal with μp=nothing and σp=nothing. (Round to three decimal places as needed.)

Glencoe Algebra 1, Student Edition, 9780079039897, 0079039898, 2018
18th Edition
ISBN:9780079039897
Author:Carter
Publisher:Carter
Chapter10: Statistics
Section10.4: Distributions Of Data
Problem 19PFA

Related questions
Question
According to a study conducted by a statistical organization, the proportion of people who are satisfied with the way things are going in their lives is
0.88.
Suppose that a random sample of
100
people is obtained. Complete parts (a) through (e) below.(a) Suppose the random sample of
100
people is asked, "Are you satisfied with the way things are going in your life?" Is the response to this question qualitative or quantitative? Explain.The response is qualitative because the responses can be classified based on the characteristic of being satisfied or not.
The response is quantitative because the number of people satisfied can be counted.
The response is quantitative because the responses can be classified based on the characteristic of being satisfied or not.
The response is qualitative because the number of people satisfied can be counted.
(b) Explain why the sample proportion,
p,
is a random variable. What is the source of the variability?The sample proportion
p
is a random variable because the value of
p
represents a random person included in the sample. The variability is due to the fact that people may not be responding to the question truthfully.The sample proportion
p
is a random variable because the value of
p
varies from sample to sample. The variability is due to the fact that different people feel differently regarding their satisfaction.The sample proportion
p
is a random variable because the value of
p
represents a random person included in the sample. The variability is due to the fact that different people feel differently regarding their satisfaction.The sample proportion
p
is a random variable because the value of
p
varies from sample to sample. The variability is due to the fact that people may not be responding to the question truthfully.(c) Describe the sampling distribution of
p,
the proportion of people who are satisfied with the way things are going in their life. Be sure to verify the model requirements.Since the sample size is
than 5% of the population size and
with
▼
no less
no more
np(1−p)=nothing≥10,
the distribution of
p
is
▼
skewed left
uniform
skewed right
approximately normal
μp=nothing
and
σp=nothing.
(Round to three decimal places as needed.)
(d) In the sample obtained in part (a), what is the probability that the proportion who are satisfied with the way things are going in their life exceeds
0.92?
The probability that the proportion who are satisfied with the way things are going in their life exceeds
0.92
is
nothing.
(Round to four decimal places as needed.)
(e) Using the distribution from part (c), would it be unusual for a survey of 100 people to reveal that
80
or fewer people in the sample are satisfied with their lives?The probability that
unusual because this probability
less than
%.
80
or fewer people in the sample are satisfied is
nothing,
which
▼
is not
is
▼
is not
is
▼
0.05
0.5
5
50
(Round to four decimal places as needed.)
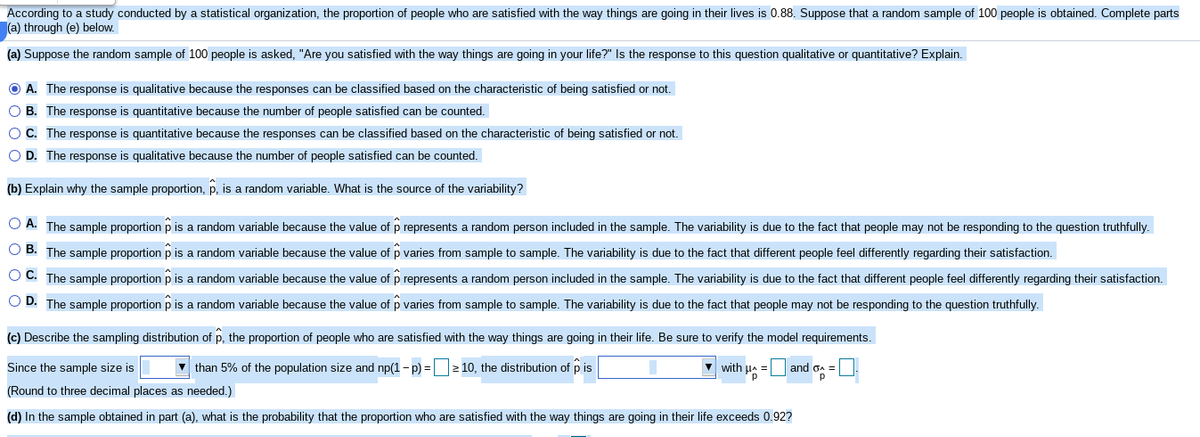
Transcribed Image Text:According to a study conducted by a statistical organization, the proportion of people who are satisfied with the way things are going in their lives is 0.88. Suppose that a random sample of 100 people is obtained. Complete parts
(a) through (e) below.
(a) Suppose the random sample of 100 people is asked, "Are you satisfied with the way things are going in your life?" Is the response to this question qualitative or quantitative? Explain.
O A. The response is qualitative because the responses can be classified based on the characteristic of being satisfied or not.
O B. The response is quantitative because the number of people satisfied can be counted.
OC. The response is quantitative because the responses can be classified based on the characteristic of being satisfied or not.
O D. The response is qualitative because the number of people satisfied can be counted,
(b) Explain why the sample proportion, p, is a random variable. What is the source of the variability?
O A. The sample proportion p is a random variable because the value of p represents a random person included in the sample. The variability is due to the fact that people may not be responding to the question truthfully.
O B. The sample proportion p is a random variable because the value of p varies from sample to sample. The variability is due to the fact that different people feel differently regarding their satisfaction.
O C. The sample proportion p is a random variable because the value of p represents a random person included in the sample. The variability is due to the fact that different people feel differently regarding their satisfaction.
O D. The sample proportion p is a random variable because the value of p varies from sample to sample. The variability is due to the fact that people may not be responding to the question truthfully.
(c) Describe the sampling distribution of p, the proportion of people who are satisfied with the way things are going in their life. Be sure to verify the model requirements.
Since the sample size is
V than 5% of the population size and np(1- p) =2 10, the distribution of p is
V with ua = and oa =
(Round to three decimal places as needed.)
(d) In the sample obtained in part (a), what is the probability that the proportion who are satisfied with the way things are going in their life exceeds 0.92?
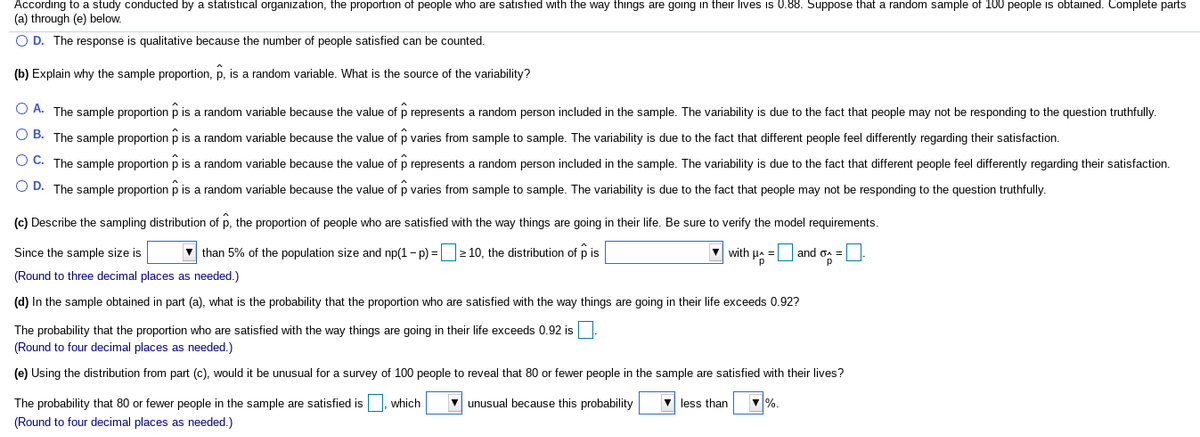
Transcribed Image Text:According to a study conducted by a statistical organization, the proportion of people who are satisfied with the way things are going in their lives is 0.88. Suppose that a random sample of 100 people is obtained. Complete parts
(a) through (e) below.
O D. The response is qualitative because the number of people satisfied can be counted.
(b) Explain why the sample proportion, p, is a random variable. What is the source of the variability?
A. The sample proportion p is a random variable because the value of p represents a random person included in the sample. The variability is due to the fact that people may not be responding to the question truthfully.
O B. The sample proportion p is a random variable because the value of p varies from sample to sample. The variability is due to the fact that different people feel differently regarding their satisfaction.
O C. The sample proportion p is a random variable because the value of p represents a random person included in the sample. The variability is due to the fact that different people feel differently regarding their satisfaction.
O D. The sample proportion p is a random variable because the value of p varies from sample to sample. The variability is due to the fact that people may not be responding to the question truthfully.
(c) Describe the sampling distribution of p, the proportion of people who are satisfied with the way things are going in their life. Be sure to verify the model requirements.
Since the sample size is
v than 5% of the population size and np(1- p) = 2 10, the distribution of p is
with Ha =U and o
(Round to three decimal places as needed.)
(d) In the sample obtained in part (a), what is the probability that the proportion who are satisfied with the way things are going in their life exceeds 0.92?
The probability that the proportion who are satisfied with the way things are going in their life exceeds 0.92 is
(Round to four decimal places as needed.)
(e) Using the distribution from part (c), would it be unusual for a survey of 100 people to reveal that 80 or fewer people in the sample are satisfied with their lives?
The probability that 80 or fewer people in the sample are satisfied is, which
unusual because this probability
less than
V%.
(Round to four decimal places as needed.)
Expert Solution
This question has been solved!
Explore an expertly crafted, step-by-step solution for a thorough understanding of key concepts.

This is a popular solution!

Trending now
This is a popular solution!

Step by step
Solved in 2 steps

Knowledge Booster


Learn more about
Need a deep-dive on the concept behind this application? Look no further. Learn more about this topic, statistics and related others by exploring similar questions and additional content below.Recommended textbooks for you
Glencoe Algebra 1, Student Edition, 9780079039897…
Algebra
ISBN:
9780079039897
Author:
Carter
Publisher:
McGraw Hill

Holt Mcdougal Larson Pre-algebra: Student Edition…
Algebra
ISBN:
9780547587776
Author:
HOLT MCDOUGAL
Publisher:
HOLT MCDOUGAL
Glencoe Algebra 1, Student Edition, 9780079039897…
Algebra
ISBN:
9780079039897
Author:
Carter
Publisher:
McGraw Hill
Holt Mcdougal Larson Pre-algebra: Student Edition…
Algebra
ISBN:
9780547587776
Author:
HOLT MCDOUGAL
Publisher:
HOLT MCDOUGAL