According to a survey in a country, 19% of adults do not own a credit card. Suppose a simple random sample of 600 adults is obtained. Complete parts (a) through (d) below. (a) Describe the sampling distribution of p, the sample proportion of adults who do not own a credit card. Choose the phrase that best describes the shape of the sampling distribution of p below. O A. Not normal because ns0.05N and np(1-p) < 10 O B. Not normal becausens0.05N and np(1 - p) 2 10 O C. Approximately normal because ns0.05N and np(1 - p) < 10 O D. Approximately normal because ns0.05N and np(1 - p) 2 10 Determine the mean of the sampling distribution of p. HA = (Round to two decimal places as needed.) Determine the standard deviation of the sampling distribution of p. (Round to three decimal places as needed.)
According to a survey in a country, 19% of adults do not own a credit card. Suppose a simple random sample of 600 adults is obtained. Complete parts (a) through (d) below. (a) Describe the sampling distribution of p, the sample proportion of adults who do not own a credit card. Choose the phrase that best describes the shape of the sampling distribution of p below. O A. Not normal because ns0.05N and np(1-p) < 10 O B. Not normal becausens0.05N and np(1 - p) 2 10 O C. Approximately normal because ns0.05N and np(1 - p) < 10 O D. Approximately normal because ns0.05N and np(1 - p) 2 10 Determine the mean of the sampling distribution of p. HA = (Round to two decimal places as needed.) Determine the standard deviation of the sampling distribution of p. (Round to three decimal places as needed.)

Holt Mcdougal Larson Pre-algebra: Student Edition 2012
1st Edition
ISBN:9780547587776
Author:HOLT MCDOUGAL
Publisher:HOLT MCDOUGAL
Chapter11: Data Analysis And Probability
Section11.4: Collecting Data
Problem 2E

Related questions
Question
25-
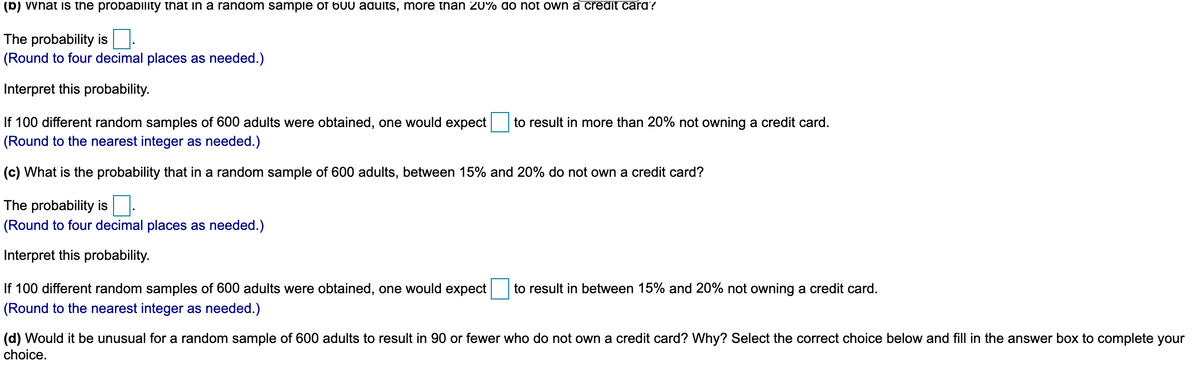
Transcribed Image Text:(b) vvnat is the probability that in a random sampie of 600 adults, more tnan 20% do not own a credit card?
The probability is
(Round to four decimal places as needed.)
Interpret this probability.
If 100 different random samples of 600 adults were obtained, one would expect
(Round to the nearest integer as needed.)
to result in more than 20% not owning a credit card.
(c) What is the probability that in a random sample of 600 adults, between 15% and 20% do not own a credit card?
The probability is
(Round to four decimal places as needed.)
Interpret this probability.
If 100 different random samples of 600 adults were obtained, one would expect
to result in between 15% and 20% not owning a credit card.
(Round to the nearest integer as needed.)
(d) Would it be unusual for a random sample of 600 adults to result in 90 or fewer who do not own a credit card? Why? Select the correct choice below and fill in the answer box to complete your
choice.
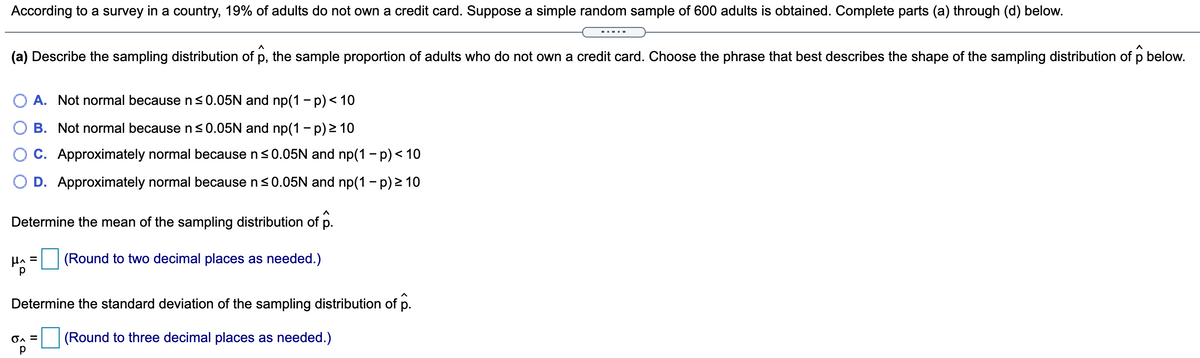
Transcribed Image Text:According to a survey in a country, 19% of adults do not own a credit card. Suppose a simple random sample of 600 adults is obtained. Complete parts (a) through (d) below.
(a) Describe the sampling distribution of p, the sample proportion of adults who do not own a credit card. Choose the phrase that best describes the shape of the sampling distribution of p below.
A. Not normal because ns0.05N and np(1 - p)< 10
O B. Not normal because n<0.05N and np(1 - p) > 10
C. Approximately normal because ns0.05N and np(1 - p) < 10
O D. Approximately normal because n<0.05N and np(1 - p) > 10
Determine the mean of the sampling distribution of p.
HA =
(Round to two decimal places as needed.)
Determine the standard deviation of the sampling distribution of p.
(Round to three decimal places as needed.)
Expert Solution
This question has been solved!
Explore an expertly crafted, step-by-step solution for a thorough understanding of key concepts.

This is a popular solution!

Trending now
This is a popular solution!

Step by step
Solved in 4 steps with 4 images

Recommended textbooks for you
Holt Mcdougal Larson Pre-algebra: Student Edition…
Algebra
ISBN:
9780547587776
Author:
HOLT MCDOUGAL
Publisher:
HOLT MCDOUGAL

College Algebra (MindTap Course List)
Algebra
ISBN:
9781305652231
Author:
R. David Gustafson, Jeff Hughes
Publisher:
Cengage Learning
Holt Mcdougal Larson Pre-algebra: Student Edition…
Algebra
ISBN:
9780547587776
Author:
HOLT MCDOUGAL
Publisher:
HOLT MCDOUGAL
College Algebra (MindTap Course List)
Algebra
ISBN:
9781305652231
Author:
R. David Gustafson, Jeff Hughes
Publisher:
Cengage Learning