The accuracy of a census report on a city in southern California was questioned by some government officials. A random sample of 1215 people living in the city was used to check the report, and the results are shown below. Sample Result Census Èthnic Origin Percent Black 10% 130 3% 38% Asian 38 466 Anglo Latino/Latina Native American 41% 515 6% 53 All others 2% 13 - Using a 1% level of significance, test the claim that the census distribution and the sample distribution agree. (a) What is the level of significance? State the null and alternate hypotheses. Ho: The distributions are different. H: The distributions are the same.
The accuracy of a census report on a city in southern California was questioned by some government officials. A random sample of 1215 people living in the city was used to check the report, and the results are shown below. Sample Result Census Èthnic Origin Percent Black 10% 130 3% 38% Asian 38 466 Anglo Latino/Latina Native American 41% 515 6% 53 All others 2% 13 - Using a 1% level of significance, test the claim that the census distribution and the sample distribution agree. (a) What is the level of significance? State the null and alternate hypotheses. Ho: The distributions are different. H: The distributions are the same.

Chapter9: Sequences, Probability And Counting Theory
Section9.7: Probability
Problem 4SE: What is the difference between events and outcomes? Give an example of both using the sample space...

Related questions

Topic Video
Question
I only need answers to the 3 unanswered questions
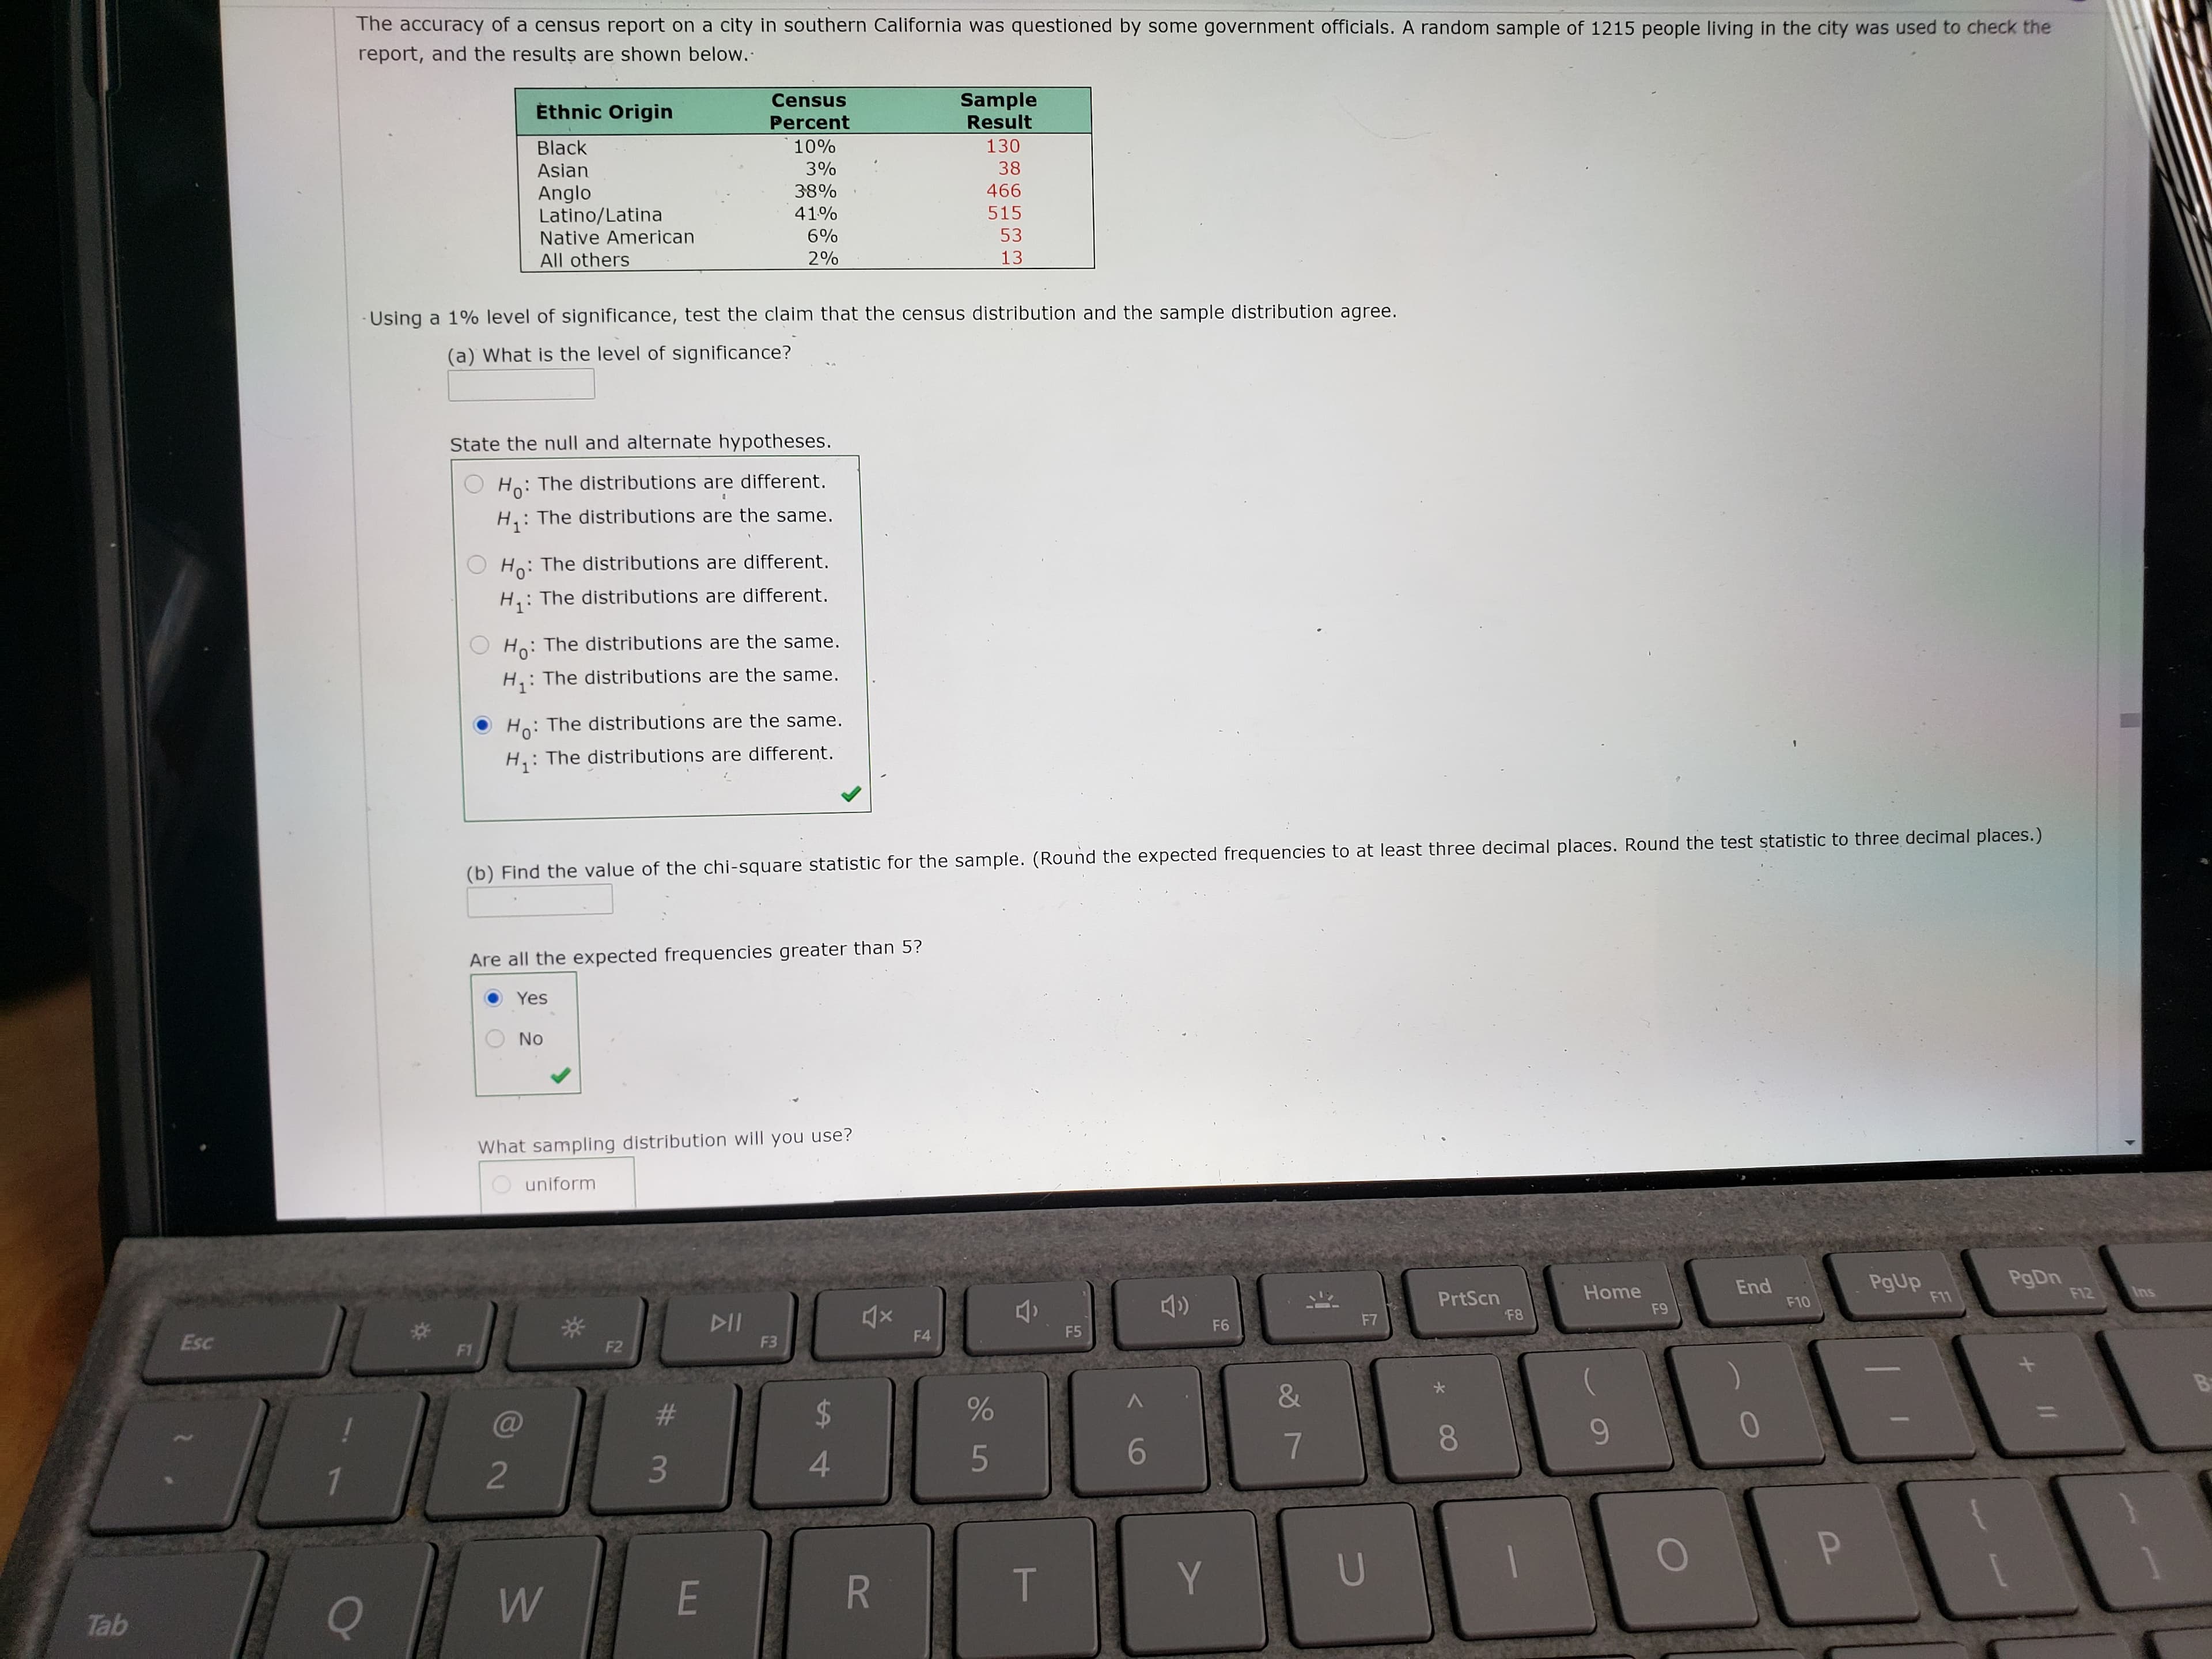
Transcribed Image Text:The accuracy of a census report on a city in southern California was questioned by some government officials. A random sample of 1215 people living in the city was used to check the
report, and the results are shown below.
Sample
Result
Census
Èthnic Origin
Percent
Black
10%
130
3%
38%
Asian
38
466
Anglo
Latino/Latina
Native American
41%
515
6%
53
All others
2%
13
- Using a 1% level of significance, test the claim that the census distribution and the sample distribution agree.
(a) What is the level of significance?
State the null and alternate hypotheses.
Ho: The distributions are different.
H: The distributions are the same.

Expert Solution
This question has been solved!
Explore an expertly crafted, step-by-step solution for a thorough understanding of key concepts.

This is a popular solution!

Trending now
This is a popular solution!

Step by step
Solved in 2 steps with 2 images

Knowledge Booster


Learn more about
Need a deep-dive on the concept behind this application? Look no further. Learn more about this topic, statistics and related others by exploring similar questions and additional content below.Recommended textbooks for you

College Algebra (MindTap Course List)
Algebra
ISBN:
9781305652231
Author:
R. David Gustafson, Jeff Hughes
Publisher:
Cengage Learning
College Algebra (MindTap Course List)
Algebra
ISBN:
9781305652231
Author:
R. David Gustafson, Jeff Hughes
Publisher:
Cengage Learning