According to the Bureau of Transportation Statistics, on-time performance by airlines is described as follows: Action % of time On Time 71 National Aviation System Delay 9. Aircraft arriving late 10 Other (weather and other conditions) 10 When a study was conducted it was found that of the 211 randomly selected flights, 150 were on time, 19 were a National Aviation System Delay, 21 arriving late , 21 were due to weather. Perform a test to see if there is sufficient evidence at a = 0.10 to see if these differ from the governments statistics. The correct hypotheses are: O Ho: The sample is a good fit to the Bureau of Transportation Statistics. HA: The sample is not a good fit to the Bureau of Transportation Statistics. (claim) O Ho: The sample is not a good fit to the Bureau of Transportation Statistics. HA: The sample is a good fit to the Bureau of Transportation Statistics.(claim) O Ho: The sample and the Bureau of Transportation Statistics are independent. HA: The sample and the Bureau of Transportation Statistics are dependent. (claim)
According to the Bureau of Transportation Statistics, on-time performance by airlines is described as follows: Action % of time On Time 71 National Aviation System Delay 9. Aircraft arriving late 10 Other (weather and other conditions) 10 When a study was conducted it was found that of the 211 randomly selected flights, 150 were on time, 19 were a National Aviation System Delay, 21 arriving late , 21 were due to weather. Perform a test to see if there is sufficient evidence at a = 0.10 to see if these differ from the governments statistics. The correct hypotheses are: O Ho: The sample is a good fit to the Bureau of Transportation Statistics. HA: The sample is not a good fit to the Bureau of Transportation Statistics. (claim) O Ho: The sample is not a good fit to the Bureau of Transportation Statistics. HA: The sample is a good fit to the Bureau of Transportation Statistics.(claim) O Ho: The sample and the Bureau of Transportation Statistics are independent. HA: The sample and the Bureau of Transportation Statistics are dependent. (claim)

Glencoe Algebra 1, Student Edition, 9780079039897, 0079039898, 2018
18th Edition
ISBN:9780079039897
Author:Carter
Publisher:Carter
Chapter10: Statistics
Section10.6: Summarizing Categorical Data
Problem 10CYU

Related questions
Question
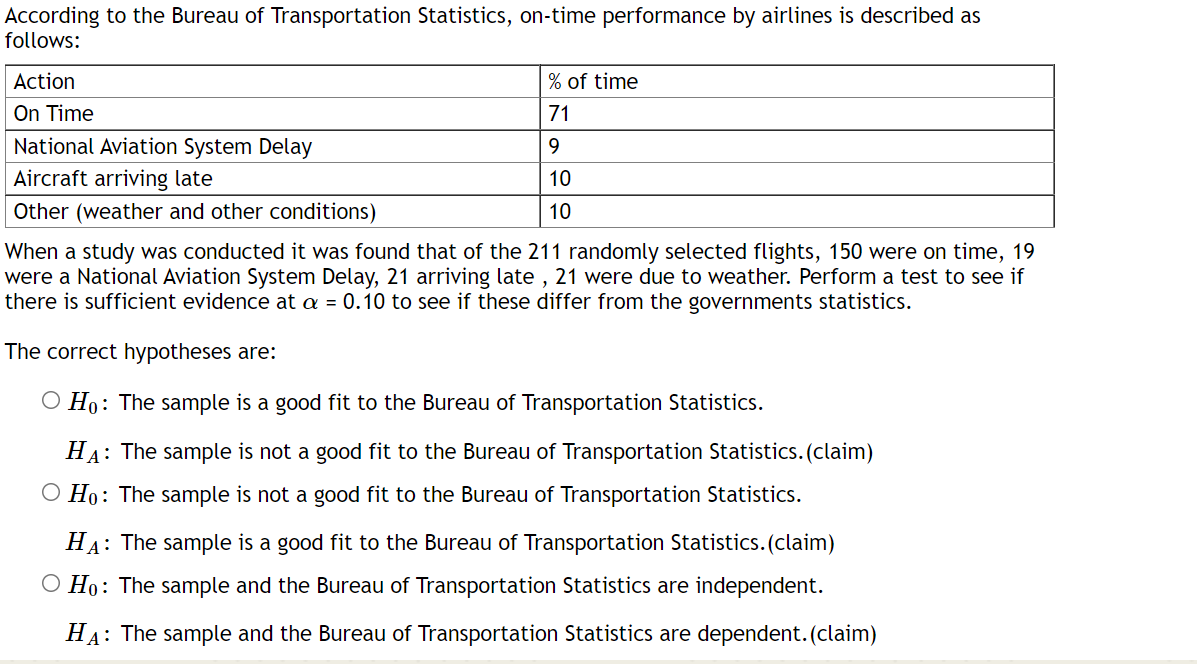
Transcribed Image Text:According to the Bureau of Transportation Statistics, on-time performance by airlines is described as
follows:
Action
% of time
On Time
National Aviation System Delay
Aircraft arriving late
71
9.
10
Other (weather and other conditions)
10
When a study was conducted it was found that of the 211 randomly selected flights, 150 were on time, 19
were a National Aviation System Delay, 21 arriving late , 21 were due to weather. Perform a test to see if
there is sufficient evidence at a = 0.10 to see if these differ from the governments statistics.
The correct hypotheses are:
O Ho: The sample is a good fit to the Bureau of Transportation Statistics.
HA: The sample is not a good fit to the Bureau of Transportation Statistics. (claim)
O Ho: The sample is not a good fit to the Bureau of Transportation Statistics.
HA: The sample is a good fit to the Bureau of Transportation Statistics. (claim)
O Ho: The sample and the Bureau of Transportation Statistics are independent.
HA: The sample and the Bureau of Transportation Statistics are dependent. (claim)
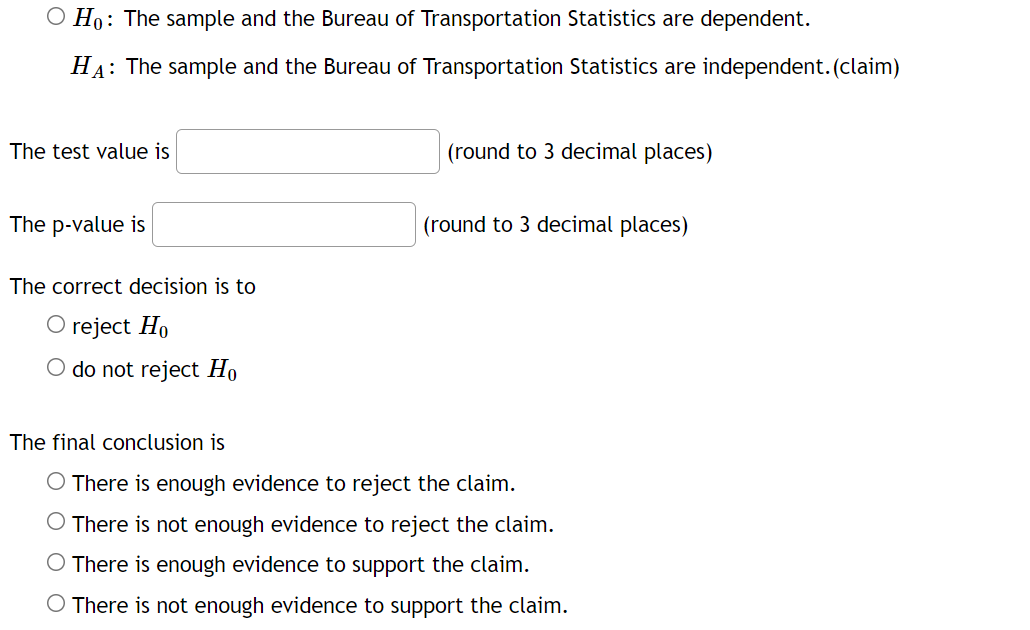
Transcribed Image Text:O Ho: The sample and the Bureau of Transportation Statistics are dependent.
HA: The sample and the Bureau of Transportation Statistics are independent.(claim)
The test value is
(round to 3 decimal places)
The p-value is
(round to 3 decimal places)
The correct decision is to
O reject Ho
O do not reject Ho
The final conclusion is
O There is enough evidence to reject the claim.
O There is not enough evidence to reject the claim.
O There is enough evidence to support the claim.
O There is not enough evidence to support the claim.
Expert Solution
This question has been solved!
Explore an expertly crafted, step-by-step solution for a thorough understanding of key concepts.

Step by step
Solved in 6 steps

Recommended textbooks for you
Glencoe Algebra 1, Student Edition, 9780079039897…
Algebra
ISBN:
9780079039897
Author:
Carter
Publisher:
McGraw Hill

Holt Mcdougal Larson Pre-algebra: Student Edition…
Algebra
ISBN:
9780547587776
Author:
HOLT MCDOUGAL
Publisher:
HOLT MCDOUGAL
Glencoe Algebra 1, Student Edition, 9780079039897…
Algebra
ISBN:
9780079039897
Author:
Carter
Publisher:
McGraw Hill
Holt Mcdougal Larson Pre-algebra: Student Edition…
Algebra
ISBN:
9780547587776
Author:
HOLT MCDOUGAL
Publisher:
HOLT MCDOUGAL