An airline is trying two new boarding procedures, Option 1 and Option 2, to load passengers onto their Long Beach (LGB) to San Francisc (SFO) flights. Since Option 1 has more automation, the airline suspects that the mean Option 1 loading time is less than the mean Option loading time. To see if this is true, the airline selects a random sample of 225 flights from LGB to SFO using Option 1 and records their loading times. The sample mean is found to be 17.4 minutes, with a sample standard deviation of 4.9 minutes. They also select an independent random sample of 205 flights from LGB to SFO using Option 2 and record their loading times. The sample mean is found to 18.6 minutes, with a sample standard deviation of 4.0 minutes. Since the sample sizes are quite large, it is assumed that the population standard deviation of the loading times using Option 1 and the loading times using Option 2 can be estimated to be the sample standard deviation values given above. At the 0.01 level of significance, is there sufficient evidence to support the claim that the mean Option 1 loading time, μ₁, is less than the mean Option 2 loading time, μ₂, for the airline's flights from LGB to SFO? Perform a one-tailed test. Ther complete the parts below. Carry your intermediate computations to at least three decimal places. (If necessary, consult a list of formulas.) (a) State the null hypothesis Ho and the alternative hypothesis H₁. O Р H :D S H₁ H₁ H₂ (b) Determine the type of test statistic to use. Degrees of freedom: (c) Find the value of the test statistic. (Round to three or more decimal places.) (d) Find the critical value at the 0.01 level of significance. (Round to three or more decimal places.) 0 (e) Can we support the claim that the mean Option 1 loading time is less than the mean Option 2 loading time for the airline's flights from LGB to SFO? Yes No F X 4 2 0=0 OSO 020 ☐#0 >0 ? 0<0 oln X G
An airline is trying two new boarding procedures, Option 1 and Option 2, to load passengers onto their Long Beach (LGB) to San Francisc (SFO) flights. Since Option 1 has more automation, the airline suspects that the mean Option 1 loading time is less than the mean Option loading time. To see if this is true, the airline selects a random sample of 225 flights from LGB to SFO using Option 1 and records their loading times. The sample mean is found to be 17.4 minutes, with a sample standard deviation of 4.9 minutes. They also select an independent random sample of 205 flights from LGB to SFO using Option 2 and record their loading times. The sample mean is found to 18.6 minutes, with a sample standard deviation of 4.0 minutes. Since the sample sizes are quite large, it is assumed that the population standard deviation of the loading times using Option 1 and the loading times using Option 2 can be estimated to be the sample standard deviation values given above. At the 0.01 level of significance, is there sufficient evidence to support the claim that the mean Option 1 loading time, μ₁, is less than the mean Option 2 loading time, μ₂, for the airline's flights from LGB to SFO? Perform a one-tailed test. Ther complete the parts below. Carry your intermediate computations to at least three decimal places. (If necessary, consult a list of formulas.) (a) State the null hypothesis Ho and the alternative hypothesis H₁. O Р H :D S H₁ H₁ H₂ (b) Determine the type of test statistic to use. Degrees of freedom: (c) Find the value of the test statistic. (Round to three or more decimal places.) (d) Find the critical value at the 0.01 level of significance. (Round to three or more decimal places.) 0 (e) Can we support the claim that the mean Option 1 loading time is less than the mean Option 2 loading time for the airline's flights from LGB to SFO? Yes No F X 4 2 0=0 OSO 020 ☐#0 >0 ? 0<0 oln X G

College Algebra (MindTap Course List)
12th Edition
ISBN:9781305652231
Author:R. David Gustafson, Jeff Hughes
Publisher:R. David Gustafson, Jeff Hughes
Chapter8: Sequences, Series, And Probability
Section8.7: Probability
Problem 6E: List the sample space of each experiment. Tossing three coins

Related questions
Question
How to solve it
Transcribed Image Text:fod07
edf
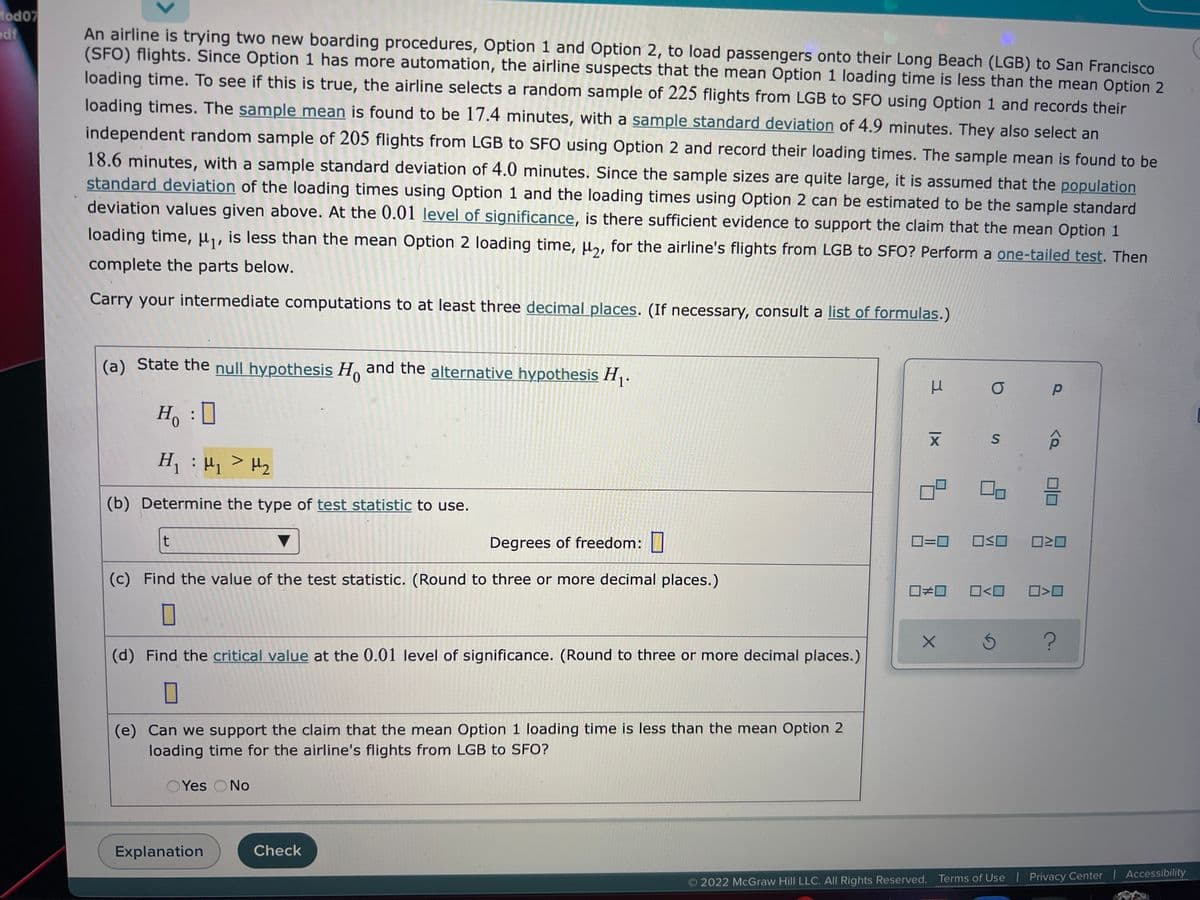
An airline is trying two new boarding procedures, Option 1 and Option 2, to load passengers onto their Long Beach (LGB) to San Francisco
(SFO) flights. Since Option 1 has more automation, the airline suspects that the mean Option 1 loading time is less than the mean Option 2
loading time. To see if this is true, the airline selects a random sample of 225 flights from LGB to SFO using Option 1 and records their
loading times. The sample mean is found to be 17.4 minutes, with a sample standard deviation of 4.9 minutes. They also select an
independent random sample of 205 flights from LGB to SFO using Option 2 and record their loading times. The sample mean is found to be
18.6 minutes, with a sample standard deviation of 4.0 minutes. Since the sample sizes are quite large, it is assumed that the population
standard deviation of the loading times using Option 1 and the loading times using Option 2 can be estimated to be the sample standard
deviation values given above. At the 0.01 level of significance, is there sufficient evidence to support the claim that the mean Option 1
loading time, μ₁, is less than the mean Option 2 loading time, μ₂, for the airline's flights from LGB to SFO? Perform a one-tailed test. Then
complete the parts below.
Carry your intermediate computations to at least three decimal places. (If necessary, consult a list of formulas.)
(a) State the null hypothesis Ho and the alternative hypothesis H₁.
о р
H:
S
H₁ = µ₁ > H₂
(b) Determine the type of test statistic to use.
t
Degrees of freedom:
(c) Find the value of the test statistic. (Round to three or more decimal places.)
0
(d) Find the critical value at the 0.01 level of significance. (Round to three or more decimal places.)
0
(e) Can we support the claim that the mean Option 1 loading time is less than the mean Option 2
loading time for the airline's flights from LGB to SFO?
Yes No
Check
Explanation
3
X
9
<Q
3
0=0 OSO 020
0#0 0<0 0>0
Ś
?
2022 McGraw Hill LLC. All Rights Reserved. Terms of Use | Privacy Center | Accessibility
X
Expert Solution
This question has been solved!
Explore an expertly crafted, step-by-step solution for a thorough understanding of key concepts.

Step by step
Solved in 2 steps

Recommended textbooks for you
College Algebra (MindTap Course List)
Algebra
ISBN:
9781305652231
Author:
R. David Gustafson, Jeff Hughes
Publisher:
Cengage Learning

College Algebra (MindTap Course List)
Algebra
ISBN:
9781305652231
Author:
R. David Gustafson, Jeff Hughes
Publisher:
Cengage Learning