According to the manufacturer of M&Ms, 13% of the plain M&Ms in a bag should be brown, 14% yellow, 13% red, 24% blue, 20% orange, and 16% green. A student randomly selected a bag of plain M&Ms. He counted the number of M&Ms of each color and obtained the results shown in the table. Test whether plain M&Ms follow the distribution stated by the manufacturer at the a = 0.05 level of significance. E Click the icon to view the table. Determine the null and alternative hypotheses. Choose the correct answer below. O A. Ho The distribution of colors is not the same as stated by the manufacturer. H The distribution of colors is the same as stated by the manufacturer. - X Observed Distribution of Colors O B. Ho The distribution of colors is the same as stated by the manufacturer. H The distribution of colors is not the same as stated by the manufacturer. OC. Ho The distribution of colors is at least as uniform as stated by the manufacturer. H, The distribution of colors is less uniform than stated by the manufacturer. Blue Orange Green Color Frequency Claimed Proportion Brown Yellow Red O D. H. The distribution of colors is at most as uniform as stated by the manufacturer . 60 63 57 60 94 64 H;. The distribution of colors is more uniform than stated by the manufacturer. |0.24 0.16 0.13 0.14 0.13 0.20 Compute the expected counts for each color. (Round to two decimal places as needed.) Print Done Color Frequency Expected Count Brown 60 Yellow 63 Red 57 Blue 60 Orange 94 Green 64 Click to select your answer(s).
According to the manufacturer of M&Ms, 13% of the plain M&Ms in a bag should be brown, 14% yellow, 13% red, 24% blue, 20% orange, and 16% green. A student randomly selected a bag of plain M&Ms. He counted the number of M&Ms of each color and obtained the results shown in the table. Test whether plain M&Ms follow the distribution stated by the manufacturer at the a = 0.05 level of significance. E Click the icon to view the table. Determine the null and alternative hypotheses. Choose the correct answer below. O A. Ho The distribution of colors is not the same as stated by the manufacturer. H The distribution of colors is the same as stated by the manufacturer. - X Observed Distribution of Colors O B. Ho The distribution of colors is the same as stated by the manufacturer. H The distribution of colors is not the same as stated by the manufacturer. OC. Ho The distribution of colors is at least as uniform as stated by the manufacturer. H, The distribution of colors is less uniform than stated by the manufacturer. Blue Orange Green Color Frequency Claimed Proportion Brown Yellow Red O D. H. The distribution of colors is at most as uniform as stated by the manufacturer . 60 63 57 60 94 64 H;. The distribution of colors is more uniform than stated by the manufacturer. |0.24 0.16 0.13 0.14 0.13 0.20 Compute the expected counts for each color. (Round to two decimal places as needed.) Print Done Color Frequency Expected Count Brown 60 Yellow 63 Red 57 Blue 60 Orange 94 Green 64 Click to select your answer(s).

Glencoe Algebra 1, Student Edition, 9780079039897, 0079039898, 2018
18th Edition
ISBN:9780079039897
Author:Carter
Publisher:Carter
Chapter10: Statistics
Section10.6: Summarizing Categorical Data
Problem 10CYU

Related questions

Concept explainers
Contingency Table
A contingency table can be defined as the visual representation of the relationship between two or more categorical variables that can be evaluated and registered. It is a categorical version of the scatterplot, which is used to investigate the linear relationship between two variables. A contingency table is indeed a type of frequency distribution table that displays two variables at the same time.
Binomial Distribution
Binomial is an algebraic expression of the sum or the difference of two terms. Before knowing about binomial distribution, we must know about the binomial theorem.
Topic Video
Question
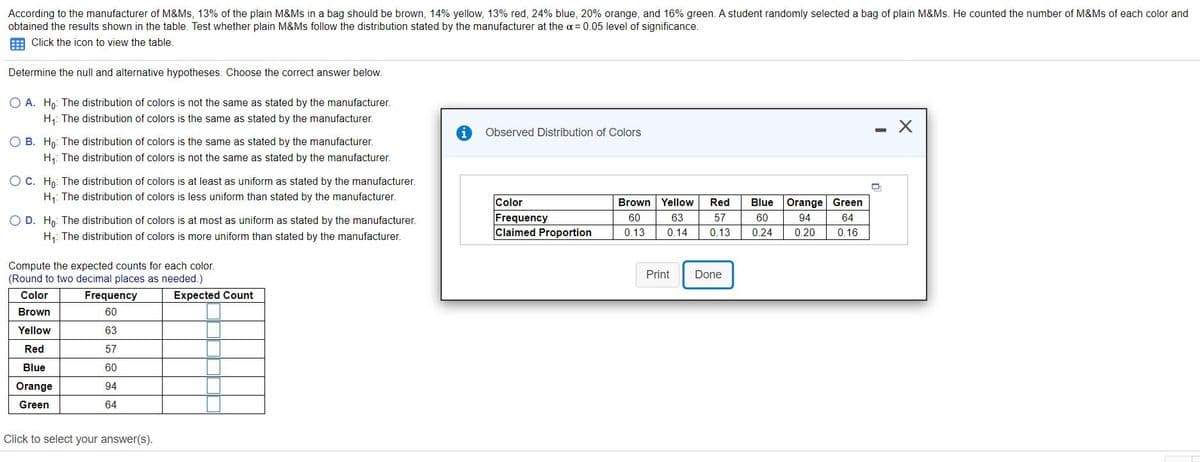
Transcribed Image Text:According to the manufacturer of M&Ms, 13% of the plain M&Ms in a bag should be brown, 14% yellow, 13% red, 24% blue, 20% orange, and 16% green. A student randomly selected a bag of plain M&Ms. He counted the number of M&Ms of each color and
obtained the results shown in the table. Test whether plain M&Ms follow the distribution stated by the manufacturer at the a = 0.05 level of significance.
E Click the icon to view the table
Determine the null and alternative hypotheses. Choose the correct answer below.
O A. Ho: The distribution of colors is not the same as stated by the manufacturer.
H1: The distribution of colors is the same as stated by the manufacturer.
Observed Distribution of Colors
O B. Hn: The distribution of colors is the same as stated by the manufacturer.
H: The distribution of colors is not the same as stated by the manufacturer.
O C. Hn: The distribution of colors is at least as uniform as stated by the manufacturer.
H: The distribution of colors is less uniform than stated by the manufacturer.
Color
Brown Yellow
Red
Blue
Orange Green
Frequency
Claimed Proportion
O D. Hn: The distribution of colors is at most as uniform as stated by the manufacturer.
60
63
57
60
94
64
0.13
0.14
0.13
0.24
0.20
0.16
H,: The distribution of colors is more uniform than stated by the manufacturer.
Compute the expected counts for each color.
(Round to two decimal places as needed.)
Print
Done
Color
Freque
Expected Count
Brown
60
Yellow
63
Red
57
Blue
60
Orange
94
Green
64
Click to select your answer(s).
Expert Solution
This question has been solved!
Explore an expertly crafted, step-by-step solution for a thorough understanding of key concepts.

This is a popular solution!

Trending now
This is a popular solution!

Step by step
Solved in 2 steps with 2 images

Knowledge Booster


Learn more about
Need a deep-dive on the concept behind this application? Look no further. Learn more about this topic, statistics and related others by exploring similar questions and additional content below.Recommended textbooks for you
Glencoe Algebra 1, Student Edition, 9780079039897…
Algebra
ISBN:
9780079039897
Author:
Carter
Publisher:
McGraw Hill

Holt Mcdougal Larson Pre-algebra: Student Edition…
Algebra
ISBN:
9780547587776
Author:
HOLT MCDOUGAL
Publisher:
HOLT MCDOUGAL

College Algebra (MindTap Course List)
Algebra
ISBN:
9781305652231
Author:
R. David Gustafson, Jeff Hughes
Publisher:
Cengage Learning
Glencoe Algebra 1, Student Edition, 9780079039897…
Algebra
ISBN:
9780079039897
Author:
Carter
Publisher:
McGraw Hill
Holt Mcdougal Larson Pre-algebra: Student Edition…
Algebra
ISBN:
9780547587776
Author:
HOLT MCDOUGAL
Publisher:
HOLT MCDOUGAL
College Algebra (MindTap Course List)
Algebra
ISBN:
9781305652231
Author:
R. David Gustafson, Jeff Hughes
Publisher:
Cengage Learning