accurately predict my diastolic blood pressure? accurately (h) For what range of systolic blood pressure readings would it be appropriate to use this regression line equation to predict diastolic blood pressure (to avoid extrapolation)?
accurately predict my diastolic blood pressure? accurately (h) For what range of systolic blood pressure readings would it be appropriate to use this regression line equation to predict diastolic blood pressure (to avoid extrapolation)?

Functions and Change: A Modeling Approach to College Algebra (MindTap Course List)
6th Edition
ISBN:9781337111348
Author:Bruce Crauder, Benny Evans, Alan Noell
Publisher:Bruce Crauder, Benny Evans, Alan Noell
Chapter3: Straight Lines And Linear Functions
Section3.CR: Chapter Review Exercises
Problem 15CR: Life Expectancy The following table shows the average life expectancy, in years, of a child born in...

Related questions

Topic Video
Question
I have asked this question 3 x and no response
Transcribed Image Text:H?
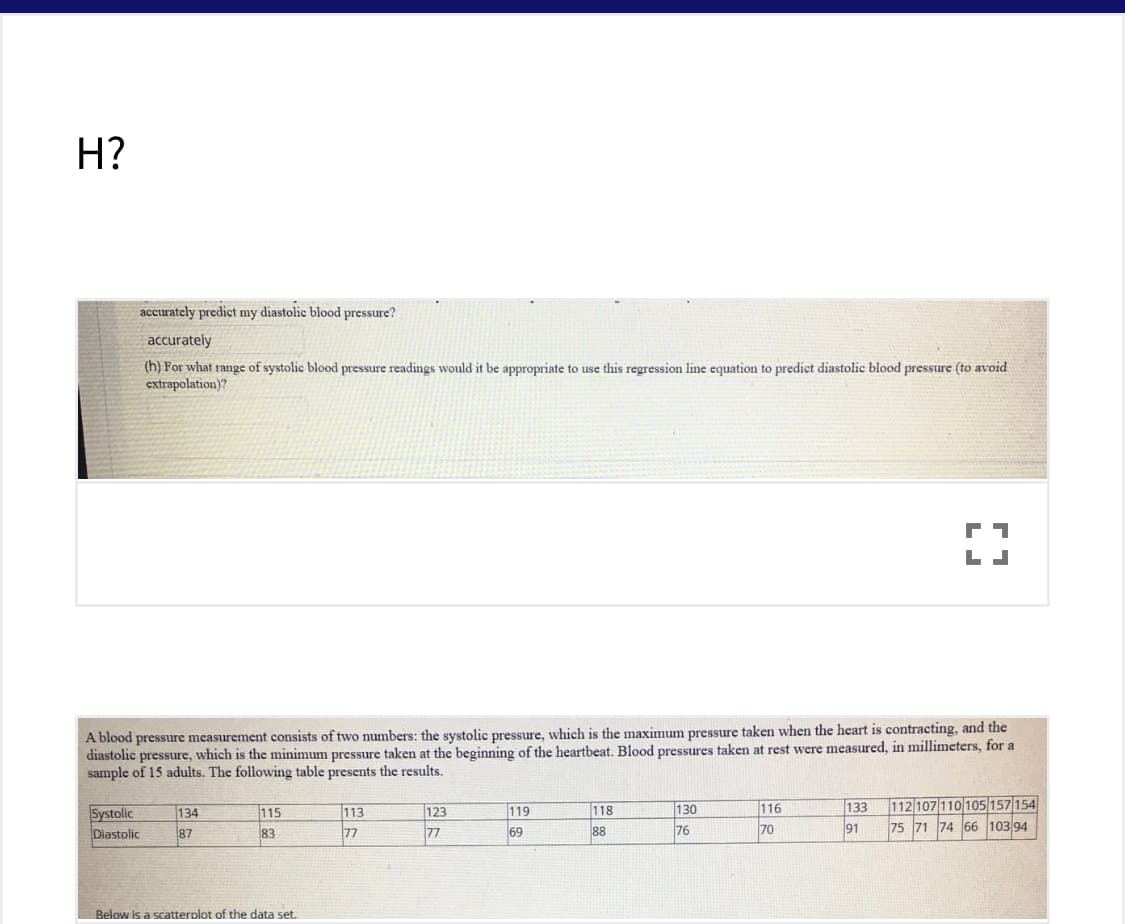
accurately predict my diastolic blood pressure?
accurately
(h) For what range of systolic blood pressure readings would it be appropriate to use this regression line equation to predict diastolic blood pressure (to avoid
extrapolation)?
A blood pressure measurement consists of two numbers: the systolic pressure, which is the maximum pressure taken when the heart is contracting, and the
diastolic pressure, which is the minimum pressure taken at the beginning of the heartbeat. Blood pressures taken at rest were measured, in millimeters, for a
sample of 15 adults. The following table presents the results.
116
133
112 107 110 105 157 154
Systolic
Diastolic
130
113
77
134
115
123
119
118
77
69
76
70
91
75 71 74 66 103 94
87
83
88
Below is a scatterplot of the data set.
Expert Solution
This question has been solved!
Explore an expertly crafted, step-by-step solution for a thorough understanding of key concepts.

This is a popular solution!

Trending now
This is a popular solution!

Step by step
Solved in 2 steps

Knowledge Booster


Learn more about
Need a deep-dive on the concept behind this application? Look no further. Learn more about this topic, statistics and related others by exploring similar questions and additional content below.Recommended textbooks for you
Functions and Change: A Modeling Approach to Coll…
Algebra
ISBN:
9781337111348
Author:
Bruce Crauder, Benny Evans, Alan Noell
Publisher:
Cengage Learning

Glencoe Algebra 1, Student Edition, 9780079039897…
Algebra
ISBN:
9780079039897
Author:
Carter
Publisher:
McGraw Hill

College Algebra
Algebra
ISBN:
9781305115545
Author:
James Stewart, Lothar Redlin, Saleem Watson
Publisher:
Cengage Learning
Functions and Change: A Modeling Approach to Coll…
Algebra
ISBN:
9781337111348
Author:
Bruce Crauder, Benny Evans, Alan Noell
Publisher:
Cengage Learning
Glencoe Algebra 1, Student Edition, 9780079039897…
Algebra
ISBN:
9780079039897
Author:
Carter
Publisher:
McGraw Hill
College Algebra
Algebra
ISBN:
9781305115545
Author:
James Stewart, Lothar Redlin, Saleem Watson
Publisher:
Cengage Learning

Algebra and Trigonometry (MindTap Course List)
Algebra
ISBN:
9781305071742
Author:
James Stewart, Lothar Redlin, Saleem Watson
Publisher:
Cengage Learning
