Activity 1 Identify the regions under the normal curve of the following standard normal values using the z table (refer to the picture) 1. z = -3.25 2. z = 1.25 3. z = 0.56 4. z = 3 5. z = 1.96 6. z = -1.33 7. z = -2.5 8. z = 0.29 9. z = -0.13 10. z = -1.96
Activity 1 Identify the regions under the normal curve of the following standard normal values using the z table (refer to the picture) 1. z = -3.25 2. z = 1.25 3. z = 0.56 4. z = 3 5. z = 1.96 6. z = -1.33 7. z = -2.5 8. z = 0.29 9. z = -0.13 10. z = -1.96

MATLAB: An Introduction with Applications
6th Edition
ISBN:9781119256830
Author:Amos Gilat
Publisher:Amos Gilat
Chapter1: Starting With Matlab
Section: Chapter Questions
Problem 1P

Related questions
Question
Activity 1
Identify the regions under the normal curve of the following standard normal values using the z table (refer to the picture)
1. z = -3.25
2. z = 1.25
3. z = 0.56
4. z = 3
5. z = 1.96
6. z = -1.33
7. z = -2.5
8. z = 0.29
9. z = -0.13
10. z = -1.96
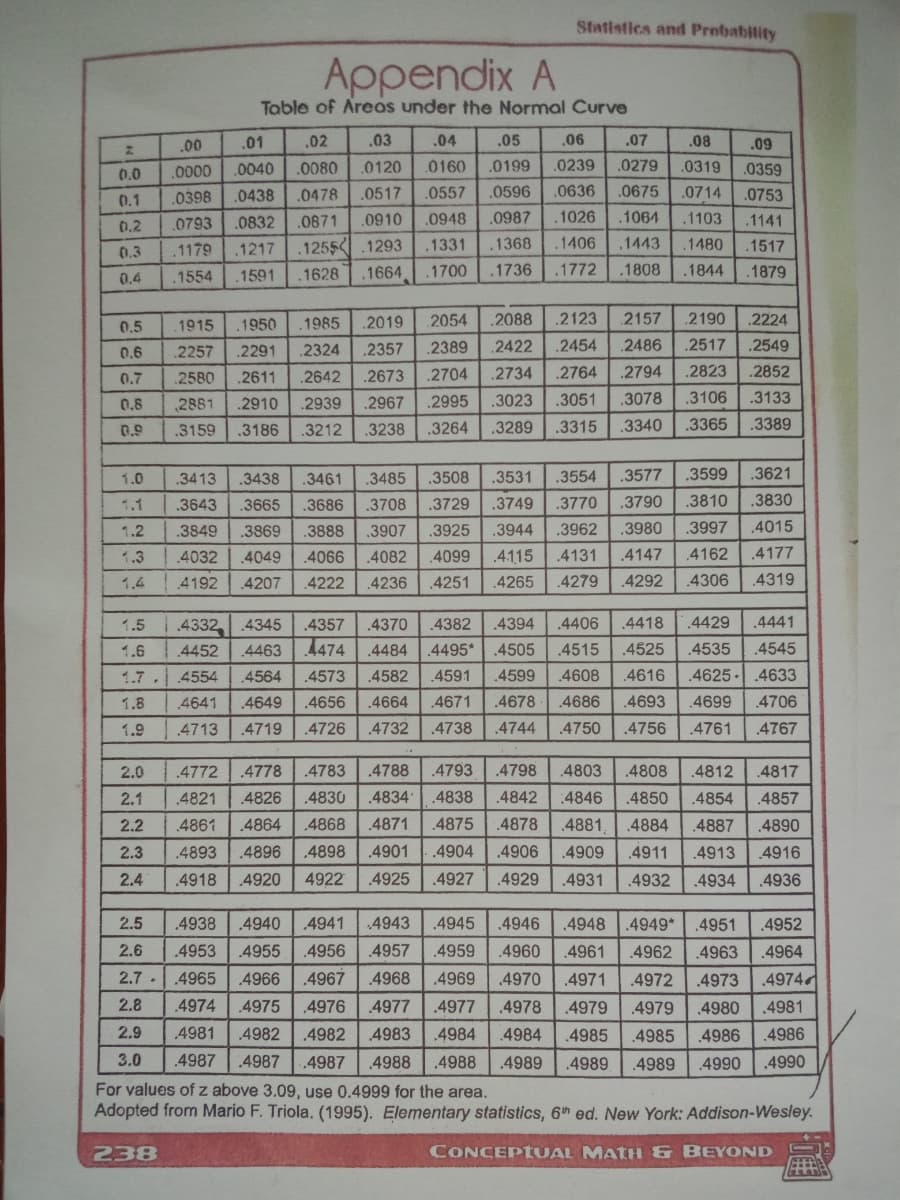
Transcribed Image Text:Statistics and Probability
Appendix A
Table of Areas under the Normal Curve
.00
.01
.02
.03
.04
.05
.06
.07
.08
.09
0.0
.0000
.0040
.0080
.0120
.0160
.0199
.0239
.0279
.0319
.0359
(0.1
.0398
.0438
.0478
.0517
.0557
.0596
.0636
.0675
.0714
.0753
.0793
.0832
.0871
0910
.0948
.0987
1026
.1064
1103
.1141
0.2
.1255<.1293
.1664
.1179
.1217
.1331
.1368
1406
1443
1480
.1517
0.3
0.4
.1554
.1591
.1628
.1700
1736
.1772
.1808
1844
1879
0.5
1915
.1950
.1985
.2019
2054
.2088
.2123
.2157
.2190
.2224
0.6
2257
.2291
.2324
.2357
2389
.2422
.2454
.2486
.2517
.2549
0.7
.2580
.2611
.2642
.2673
.2704
.2734
.2764
.2794
.2823
.2852
0.8
2881
.2910
.2939
.2967
.2995
.3023
.3051
.3078
.3106
.3133
0.9
.3159
.3186
.3212
.3238
.3264
.3289
.3315
.3340
.3365
.3389
1.0
.3413
.3438
.3461
.3485
.3508
.3531
.3554
.3577
.3599
.3621
1.1
.3643
.3665
.3686
.3708
.3729
.3749
.3770
.3790
.3810
.3830
1.2
.3849
.3869
.3888
.3907
.3925
.3944
.3962
.3980
.3997
.4015
1.3
4032
.4049
4066
.4082
4099
.4115
.4131
.4147
.4162
.4177
1.4
4192
.4207
.4222
.4236
.4251
.4265
.4279
4292
.4306
.4319
1.5
.4332
4345
.4357
.4370
.4382
.4394
.4406
.4418
.4429
4441
1.6
4452
.4463
1474
.4484
.4495*
.4505
.4515
.4525
.4535
.4545
1.7.
4554
4564
.4573
.4582
4591
.4599
.4608
.4616
.4625-.4633
1.8
4641
4649
.4656
.4664
.4671
.4678
.4686
.4693
4699
4706
1.9
.4713
.4719
.4726
.4732
.4738
.4744
.4750
.4756
.4761
.4767
2.0
.4772
.4778
.4783
.4788
.4793
.4798
.4803
.4808
.4812
.4817
2.1
.4821
4826
.4830
.4834
.4838
.4842
:4846
.4850
.4854
.4857
2.2
4861
.4864
.4868
.4871
.4875
.4878
.4881
.4884
.4887
.4890
2.3
.4893
.4896
.4898
.4901
.4904
.4906
.4909
4911
.4913
4916
2.4
.4918
4920
4922
4925
.4927
.4929
.4931
.4932
.4934
.4936
2.5
.4938
.4940
4941
4943
.4945
.4946
.4948
.4949*
.4951
.4952
2.6
.4953
4955
.4956
.4957
.4959
.4960
.4961
.4962
.4963
.4964
2.7 -.4965
4966
.4967
.4968
.4969
.4970
.4971
.4972
.4973
.4974
2.8
.4974
.4975
.4976
.4977
.4977
.4978
4979
.4979
4980
.4981
2.9
4981
.4982
.4982
4983
.4984
.4984
.4985
.4985
4986
.4986
3.0
.4987
4987
.4987
.4988
.4988
.4989
.4989
.4989
4990
.4990
For values of z above 3.09, use 0.4999 for the area.
Adopted from Mario F. Triola. (1995). Elementary statistics, 6th ed. New York: Addison-Wesley.
238
CONCEPtUAL MATH& BEYOND
of
222
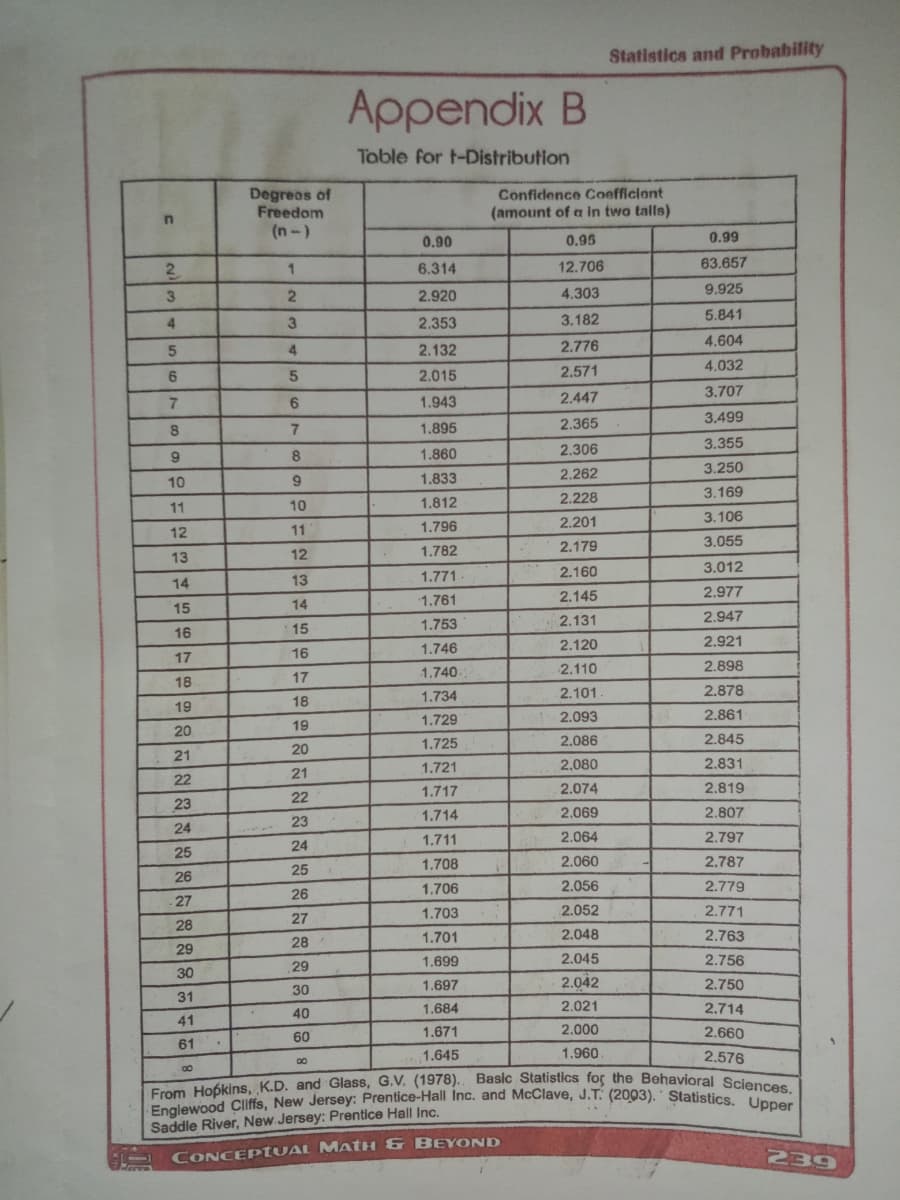
Transcribed Image Text:Englewood CIiffs, New Jersey: Prentice-Hall Inc. and McClave, J.T: (2003). Statistics. Upper
From Hopkins, K.D. and Glass, G.V. (1978). Basic Statistics for the Behavioral Sciences.
Statistics and Probability
Appendix B
Toble for t-Distribution
Degreos of
Freedom
(n-)
Confidence Coefficiont
(amount of a in two talls)
0,90
0.95
0.99
2.
6.314
12.706
63.657
2.920
4.303
9,925
3.182
5.841
4
3.
2.353
4,604
4
2.132
2.776
4.032
2.015
2.571
3.707
6
1.943
2.447
2.365
3.499
7.
1.895
2.306
3.355
9.
8
1.860
3.250
9.
1.833
2.262
10
3.169
10
1.812
2.228
11
2.201
3.106
12
11
1.796
3.055
1.782
2.179
13
12
2.160
3.012
13
1.771
14
2.145
2.977
14
1.761
15
1.753
2.131
2.947
16
15
1.746
2.120
2.921
17
16
1.740
2.110
2.898
18
17
1.734
2.101.
2.878
18
19
1.729
2.093
2.861
19
20
1.725
2.086
2.845
20
21
1.721
2,080
2.831
21
22
1.717
2.074
2.819
22
23
1.714
2.069
2.807
23
24
1.711
2.064
2.797
24
25
1.708
2.060
2.787
25
26
1.706
2.056
2.779
26
27
1.703
2.052
2.771
27
28
1.701
2.048
2.763
28
29
1.699
2.045
2.756
29
30
1.697
2.042
2.750
30
31
1.684
2.021
2.714
40
41
60
1.671
2.000
2.660
61
1.645
1.960
2.576
From Hobkins, K.D. and Glass, G.V. (1978). Baslc Statistcs for the Behavioral Sciene
Saddle River, New Jersey: Prentice Hall Inc.
CONCEPTUAL MatH & BEYOND
Expert Solution
This question has been solved!
Explore an expertly crafted, step-by-step solution for a thorough understanding of key concepts.

Step by step
Solved in 3 steps with 2 images

Recommended textbooks for you
MATLAB: An Introduction with Applications
Statistics
ISBN:
9781119256830
Author:
Amos Gilat
Publisher:
John Wiley & Sons Inc

Probability and Statistics for Engineering and th…
Statistics
ISBN:
9781305251809
Author:
Jay L. Devore
Publisher:
Cengage Learning

Statistics for The Behavioral Sciences (MindTap C…
Statistics
ISBN:
9781305504912
Author:
Frederick J Gravetter, Larry B. Wallnau
Publisher:
Cengage Learning
MATLAB: An Introduction with Applications
Statistics
ISBN:
9781119256830
Author:
Amos Gilat
Publisher:
John Wiley & Sons Inc
Probability and Statistics for Engineering and th…
Statistics
ISBN:
9781305251809
Author:
Jay L. Devore
Publisher:
Cengage Learning
Statistics for The Behavioral Sciences (MindTap C…
Statistics
ISBN:
9781305504912
Author:
Frederick J Gravetter, Larry B. Wallnau
Publisher:
Cengage Learning

Elementary Statistics: Picturing the World (7th E…
Statistics
ISBN:
9780134683416
Author:
Ron Larson, Betsy Farber
Publisher:
PEARSON

The Basic Practice of Statistics
Statistics
ISBN:
9781319042578
Author:
David S. Moore, William I. Notz, Michael A. Fligner
Publisher:
W. H. Freeman

Introduction to the Practice of Statistics
Statistics
ISBN:
9781319013387
Author:
David S. Moore, George P. McCabe, Bruce A. Craig
Publisher:
W. H. Freeman