Addai Company has provided the following comparative information: 20Υ8 20Υ7 20Υ6 20Υ5 20Υ4 Net income $273,406 $367,976 $631,176 $884,000 $800,000 Interest expense 616,047 572,003 528,165 495,000 440,000 Income tax expense 31,749 53,560 106,720 160,000 200,000 Total assets (ending balance) 4,417,178 4,124,350 3,732,443 3,338,500 2,750,000 Total stockholders' equity (ending balance) 3,706,557 3,433,152 3,065,176 2,434,000 1,550,000 Average total assets 4,270,764 3,928,396 3,535,472 3,044,250 2,475,000 Average total stockholders' equity 3,569,855 3,249,164 2,749,588 1,992,000 1,150,000 You have been asked to evaluate the historical performance of the company over the last five years. Selected industry ratios have remained relatively steady at the following levels for the last five years: 20Y4-20Y8 Return on total assets 28% Return on stockholders' equity 18% Times interest earned 2.7 Ratio of liabilities to stockholders' equity 0.4 Required: 1. Determine the following for the years 20Y4 through 20Y8 for each of the graphs below. Use the amounts given above in your calculations. Round to one decimal place:
Addai Company has provided the following comparative information: 20Υ8 20Υ7 20Υ6 20Υ5 20Υ4 Net income $273,406 $367,976 $631,176 $884,000 $800,000 Interest expense 616,047 572,003 528,165 495,000 440,000 Income tax expense 31,749 53,560 106,720 160,000 200,000 Total assets (ending balance) 4,417,178 4,124,350 3,732,443 3,338,500 2,750,000 Total stockholders' equity (ending balance) 3,706,557 3,433,152 3,065,176 2,434,000 1,550,000 Average total assets 4,270,764 3,928,396 3,535,472 3,044,250 2,475,000 Average total stockholders' equity 3,569,855 3,249,164 2,749,588 1,992,000 1,150,000 You have been asked to evaluate the historical performance of the company over the last five years. Selected industry ratios have remained relatively steady at the following levels for the last five years: 20Y4-20Y8 Return on total assets 28% Return on stockholders' equity 18% Times interest earned 2.7 Ratio of liabilities to stockholders' equity 0.4 Required: 1. Determine the following for the years 20Y4 through 20Y8 for each of the graphs below. Use the amounts given above in your calculations. Round to one decimal place:

Survey of Accounting (Accounting I)
8th Edition
ISBN:9781305961883
Author:Carl Warren
Publisher:Carl Warren
Chapter9: Metric-analysis Of Financial Statements
Section: Chapter Questions
Problem 9.4.12P: Twenty metrics of liquidity, solvency, and profitability The comparative financial statements of...

Related questions
Question
100%
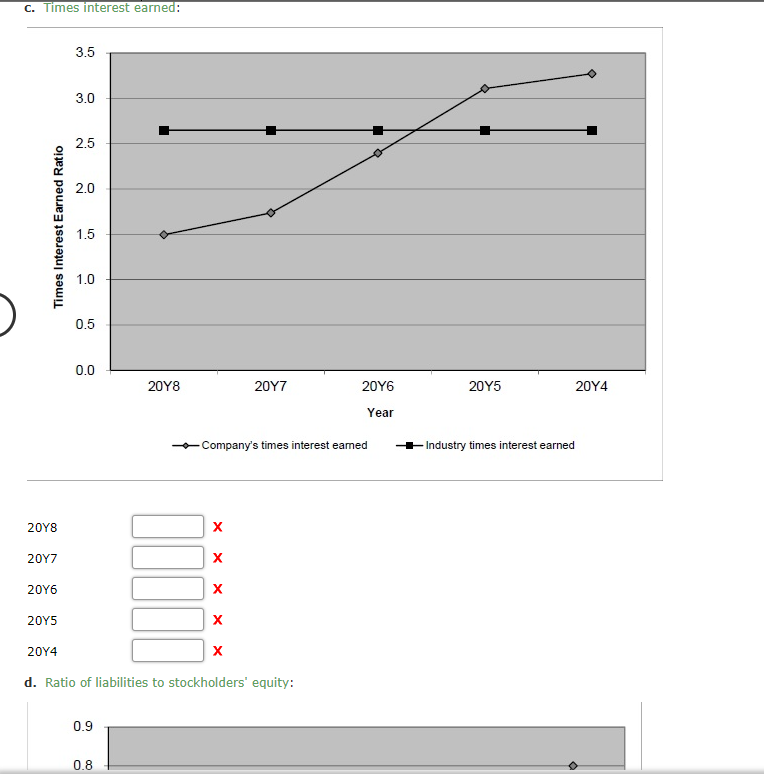
Transcribed Image Text:C. Times interest earned:
3.5
3.0
2.5
2.0
1.5
1.0
0.5
0.0
20Υ8
20Y7
20Y6
20Y5
20Υ4
Year
-Company's times interest eamed
Industry times interest earned
20Υ8
20Υ7
20Υ6
20Y5
20Y4
d. Ratio of liabilities to stockholders' equity:
0.9
0.8
Times Interest Earned Ratio
x x x x
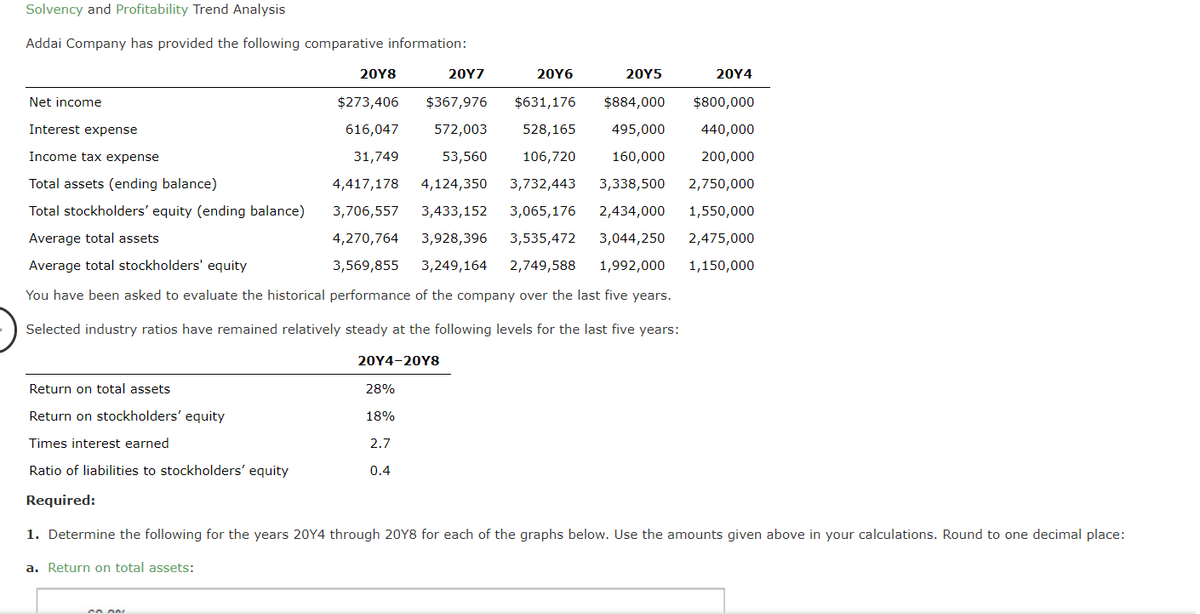
Transcribed Image Text:Solvency and Profitability Trend Analysis
Addai Company has provided the following comparative information:
20Y8
20Υ7
20Y6
20Υ5
20Y4
Net income
$273,406
$367,976
$631,176
$884,000
$800,000
Interest expense
616,047
572,003
528,165
495,000
440,000
Income tax expense
31,749
53,560
106,720
160,000
200,000
Total assets (ending balance)
4,417,178
4,124,350
3,732,443
3,338,500
2,750,000
Total stockholders' equity (ending balance)
3,706,557
3,433,152
3,065,176
2,434,000
1,550,000
Average total assets
4,270,764
3,928,396
3,535,472
3,044,250
2,475,000
Average total stockholders' equity
3,569,855
3,249,164
2,749,588
1,992,000
1,150,000
You have been asked to evaluate the historical performance of the company over the last five years.
Selected industry ratios have remained relatively steady at the following levels for the last five years:
20Υ4-20Υ8
Return on total assets
28%
Return on stockholders' equity
18%
Times interest earned
2.7
Ratio of liabilities to stockholders' equity
0.4
Required:
1. Determine the following for the years 20Y4 through 20Y8 for each of the graphs below. Use the amounts given above in your calculations. Round to one decimal place:
a. Return on total assets:
Expert Solution
This question has been solved!
Explore an expertly crafted, step-by-step solution for a thorough understanding of key concepts.

This is a popular solution!

Trending now
This is a popular solution!

Step by step
Solved in 2 steps with 2 images

Knowledge Booster


Learn more about
Need a deep-dive on the concept behind this application? Look no further. Learn more about this topic, accounting and related others by exploring similar questions and additional content below.Recommended textbooks for you
Survey of Accounting (Accounting I)
Accounting
ISBN:
9781305961883
Author:
Carl Warren
Publisher:
Cengage Learning

Fundamentals of Financial Management (MindTap Cou…
Finance
ISBN:
9781337395250
Author:
Eugene F. Brigham, Joel F. Houston
Publisher:
Cengage Learning

Survey of Accounting (Accounting I)
Accounting
ISBN:
9781305961883
Author:
Carl Warren
Publisher:
Cengage Learning
Fundamentals of Financial Management (MindTap Cou…
Finance
ISBN:
9781337395250
Author:
Eugene F. Brigham, Joel F. Houston
Publisher:
Cengage Learning

Cornerstones of Financial Accounting
Accounting
ISBN:
9781337690881
Author:
Jay Rich, Jeff Jones
Publisher:
Cengage Learning