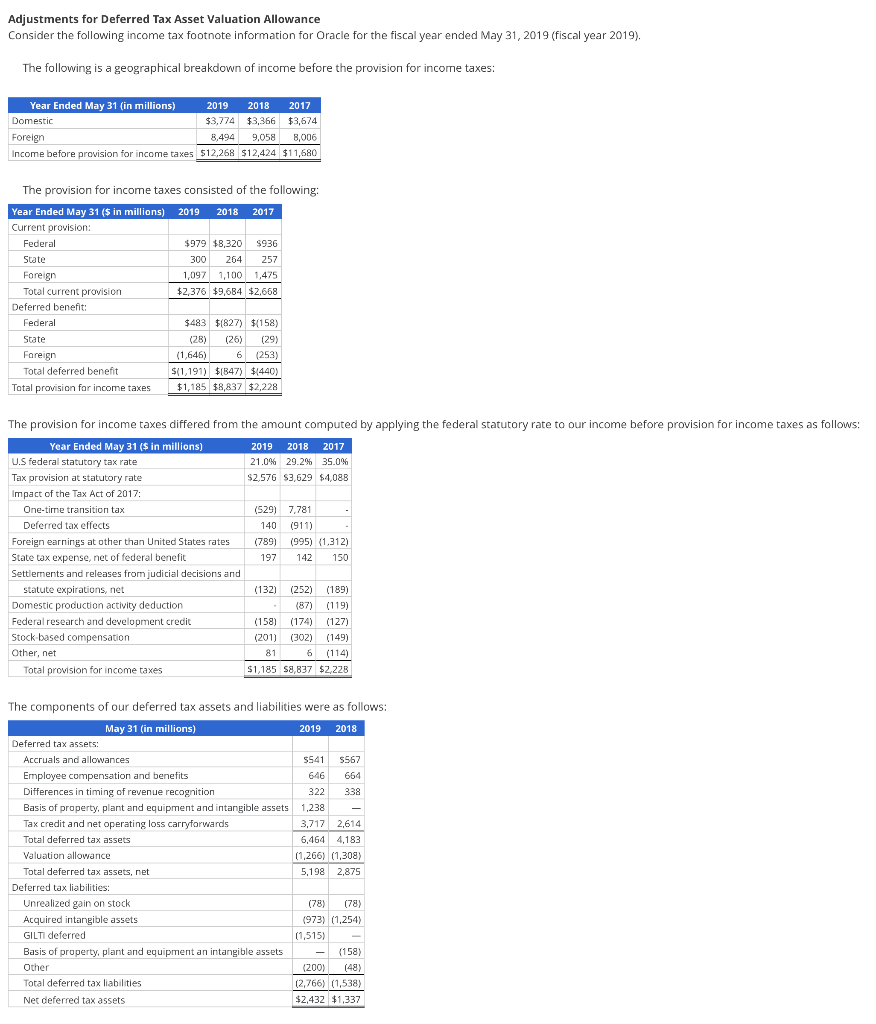
Adjustments for Deferred Tax Asset Valuation Allowance Consider the following income tax footnote information for Oracle for the fiscal year ended May 31, 2019 (fiscal year 2019). The following is a geographical breakdown of income before the provision for income taxes: Year Ended May 31 (in millions) Domestic 2019 2018 2017 $3,774 $3,366 $3,674 Foreign 8,494 9,058 8,006 Income before provision for income taxes $12,268 $12,424 $11,680 The provision for income taxes consisted of the following: Year Ended May 31 ($ in millions) Current provision: Federal State 2019 2018 2017 $979 $8,320 $936 257 300 264 1,097 1,100 1,475 Foreign Total current provision $2,376 $9,684 $2,668 Deferred benefit: Federal State Foreign Total deferred benefit Total provision for income taxes $483 $(827) $(158) (28) (26) (29) (1,646) 6 (253) $(1,191) $(847) $(440) $1,185 $8,837 $2,228 The provision for income taxes differed from the amount computed by applying the federal statutory rate to our income before provision for income taxes as follows: Year Ended May 31 ($ in millions) U.S federal statutory tax rate Tax provision at statutory rate 2019 2018 2017 21.0% 29.2% 35.0% $2,576 $3,629 $4,088 Impact of the Tax Act of 2017: One-time transition tax (529) 7,781 Deferred tax effects 140 (911) Foreign earnings at other than United States rates (789) (995) (1,312) State tax expense, net of federal benefit 197 142 150 Settlements and releases from judicial decisions and statute expirations, net (132) (252) (189) Domestic production activity deduction (87) (119) Federal research and development credit (158) (174) (127) Stock-based compensation (201) (302) (149) Other, net 81 6 (114) Total provision for income taxes $1,185 $8,837 $2,228 The components of our deferred tax assets and liabilities were as follows: May 31 (in millions) 2019 2018 Deferred tax assets: Accruals and allowances $541 $567 Employee compensation and benefits 646 664 Differences in timing of revenue recognition 322 338 Basis of property, plant and equipment and intangible assets 1,238 - Tax credit and net operating loss carryforwards 3,717 2,614 Total deferred tax assets 6,464 4,183 Valuation allowance Total deferred tax assets, net (1,266) (1,308) 5,198 2,875 Deferred tax liabilities: Unrealized gain on stock Acquired intangible assets (78) (78) (973) (1,254) GILTI deferred Basis of property, plant and equipment an intangible assets Other Total deferred tax liabilities Net deferred tax assets (1,515) (158) (200) (48) (2,766) (1,538) $2,432 $1,337 Required a. Use the four-year average valuation allowance to deferred tax assets (2016-2019) of 22.55% to adjust the income statement for each of the four years 2016-2019. Follow Analyst Adjustments 10.3 for guidance in the adjustment process. Note: Use a negative sign to indicate an income statement reversal. Note: Do not round until your final answer; round your final answers below to the nearest whole dollar. Income Statement Adjustments ($ millions) Income tax expense Net income 2016 2017 2018 2019 $ $ $ $ b. Adjust the balance sheet for each of the four years 2016-2019. Note: Use a negative sign to indicate a decrease of the balance sheet accounts. Note: Round your answers to the nearest whole dollar. Balance Sheet Adjustments ($ millions) Valuation allowance Deferred tax assets, net Total assets Retained Earnings 2016 2017 2018 2019 $ $ $ $
Adjustments for Deferred Tax Asset Valuation Allowance Consider the following income tax footnote information for Oracle for the fiscal year ended May 31, 2019 (fiscal year 2019). The following is a geographical breakdown of income before the provision for income taxes: Year Ended May 31 (in millions) Domestic 2019 2018 2017 $3,774 $3,366 $3,674 Foreign 8,494 9,058 8,006 Income before provision for income taxes $12,268 $12,424 $11,680 The provision for income taxes consisted of the following: Year Ended May 31 ($ in millions) Current provision: Federal State 2019 2018 2017 $979 $8,320 $936 257 300 264 1,097 1,100 1,475 Foreign Total current provision $2,376 $9,684 $2,668 Deferred benefit: Federal State Foreign Total deferred benefit Total provision for income taxes $483 $(827) $(158) (28) (26) (29) (1,646) 6 (253) $(1,191) $(847) $(440) $1,185 $8,837 $2,228 The provision for income taxes differed from the amount computed by applying the federal statutory rate to our income before provision for income taxes as follows: Year Ended May 31 ($ in millions) U.S federal statutory tax rate Tax provision at statutory rate 2019 2018 2017 21.0% 29.2% 35.0% $2,576 $3,629 $4,088 Impact of the Tax Act of 2017: One-time transition tax (529) 7,781 Deferred tax effects 140 (911) Foreign earnings at other than United States rates (789) (995) (1,312) State tax expense, net of federal benefit 197 142 150 Settlements and releases from judicial decisions and statute expirations, net (132) (252) (189) Domestic production activity deduction (87) (119) Federal research and development credit (158) (174) (127) Stock-based compensation (201) (302) (149) Other, net 81 6 (114) Total provision for income taxes $1,185 $8,837 $2,228 The components of our deferred tax assets and liabilities were as follows: May 31 (in millions) 2019 2018 Deferred tax assets: Accruals and allowances $541 $567 Employee compensation and benefits 646 664 Differences in timing of revenue recognition 322 338 Basis of property, plant and equipment and intangible assets 1,238 - Tax credit and net operating loss carryforwards 3,717 2,614 Total deferred tax assets 6,464 4,183 Valuation allowance Total deferred tax assets, net (1,266) (1,308) 5,198 2,875 Deferred tax liabilities: Unrealized gain on stock Acquired intangible assets (78) (78) (973) (1,254) GILTI deferred Basis of property, plant and equipment an intangible assets Other Total deferred tax liabilities Net deferred tax assets (1,515) (158) (200) (48) (2,766) (1,538) $2,432 $1,337 Required a. Use the four-year average valuation allowance to deferred tax assets (2016-2019) of 22.55% to adjust the income statement for each of the four years 2016-2019. Follow Analyst Adjustments 10.3 for guidance in the adjustment process. Note: Use a negative sign to indicate an income statement reversal. Note: Do not round until your final answer; round your final answers below to the nearest whole dollar. Income Statement Adjustments ($ millions) Income tax expense Net income 2016 2017 2018 2019 $ $ $ $ b. Adjust the balance sheet for each of the four years 2016-2019. Note: Use a negative sign to indicate a decrease of the balance sheet accounts. Note: Round your answers to the nearest whole dollar. Balance Sheet Adjustments ($ millions) Valuation allowance Deferred tax assets, net Total assets Retained Earnings 2016 2017 2018 2019 $ $ $ $

Intermediate Accounting: Reporting And Analysis
3rd Edition
ISBN:9781337788281
Author:James M. Wahlen, Jefferson P. Jones, Donald Pagach
Publisher:James M. Wahlen, Jefferson P. Jones, Donald Pagach
Chapter18: Accounting For Income Taxes
Section: Chapter Questions
Problem 12P: Comprehensive Colt Company reports pretax financial income of 143,000 in 2019. In addition to pretax...

Related questions
Question
Transcribed Image Text:Adjustments for Deferred Tax Asset Valuation Allowance
Consider the following income tax footnote information for Oracle for the fiscal year ended May 31, 2019 (fiscal year 2019).
The following is a geographical breakdown of income before the provision for income taxes:
Year Ended May 31 (in millions)
Domestic
2019
2018
2017
$3,774 $3,366 $3,674
Foreign
8,494 9,058 8,006
Income before provision for income taxes $12,268 $12,424 $11,680
The provision for income taxes consisted of the following:
Year Ended May 31 ($ in millions)
Current provision:
Federal
State
2019 2018 2017
$979 $8,320 $936
257
300 264
1,097 1,100 1,475
Foreign
Total current provision
$2,376 $9,684 $2,668
Deferred benefit:
Federal
State
Foreign
Total deferred benefit
Total provision for income taxes
$483 $(827) $(158)
(28) (26) (29)
(1,646)
6 (253)
$(1,191) $(847) $(440)
$1,185 $8,837 $2,228
The provision for income taxes differed from the amount computed by applying the federal statutory rate to our income before provision for income taxes as follows:
Year Ended May 31 ($ in millions)
U.S federal statutory tax rate
Tax provision at statutory rate
2019 2018 2017
21.0% 29.2% 35.0%
$2,576 $3,629 $4,088
Impact of the Tax Act of 2017:
One-time transition tax
(529) 7,781
Deferred tax effects
140 (911)
Foreign earnings at other than United States rates
(789)
(995) (1,312)
State tax expense, net of federal benefit
197
142 150
Settlements and releases from judicial decisions and
statute expirations, net
(132)
(252) (189)
Domestic production activity deduction
(87) (119)
Federal research and development credit
(158)
(174) (127)
Stock-based compensation
(201) (302) (149)
Other, net
81
6 (114)
Total provision for income taxes
$1,185 $8,837 $2,228
The components of our deferred tax assets and liabilities were as follows:
May 31 (in millions)
2019
2018
Deferred tax assets:
Accruals and allowances
$541 $567
Employee compensation and benefits
646
664
Differences in timing of revenue recognition
322
338
Basis of property, plant and equipment and intangible assets
1,238
-
Tax credit and net operating loss carryforwards
3,717 2,614
Total deferred tax assets
6,464 4,183
Valuation allowance
Total deferred tax assets, net
(1,266) (1,308)
5,198 2,875
Deferred tax liabilities:
Unrealized gain on stock
Acquired intangible assets
(78) (78)
(973) (1,254)
GILTI deferred
Basis of property, plant and equipment an intangible assets
Other
Total deferred tax liabilities
Net deferred tax assets
(1,515)
(158)
(200) (48)
(2,766) (1,538)
$2,432 $1,337
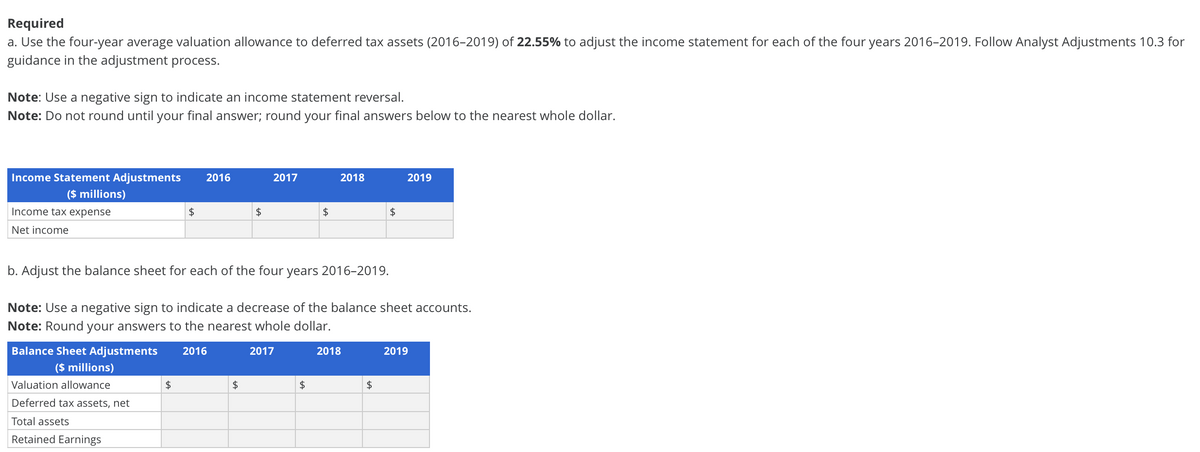
Transcribed Image Text:Required
a. Use the four-year average valuation allowance to deferred tax assets (2016-2019) of 22.55% to adjust the income statement for each of the four years 2016-2019. Follow Analyst Adjustments 10.3 for
guidance in the adjustment process.
Note: Use a negative sign to indicate an income statement reversal.
Note: Do not round until your final answer; round your final answers below to the nearest whole dollar.
Income Statement Adjustments
($ millions)
Income tax expense
Net income
2016
2017
2018
2019
$
$
$
$
b. Adjust the balance sheet for each of the four years 2016-2019.
Note: Use a negative sign to indicate a decrease of the balance sheet accounts.
Note: Round your answers to the nearest whole dollar.
Balance Sheet Adjustments
($ millions)
Valuation allowance
Deferred tax assets, net
Total assets
Retained Earnings
2016
2017
2018
2019
$
$
$
$
Expert Solution
This question has been solved!
Explore an expertly crafted, step-by-step solution for a thorough understanding of key concepts.

This is a popular solution!

Trending now
This is a popular solution!

Step by step
Solved in 2 steps

Recommended textbooks for you
Intermediate Accounting: Reporting And Analysis
Accounting
ISBN:
9781337788281
Author:
James M. Wahlen, Jefferson P. Jones, Donald Pagach
Publisher:
Cengage Learning

Financial Accounting: The Impact on Decision Make…
Accounting
ISBN:
9781305654174
Author:
Gary A. Porter, Curtis L. Norton
Publisher:
Cengage Learning

Intermediate Accounting: Reporting And Analysis
Accounting
ISBN:
9781337788281
Author:
James M. Wahlen, Jefferson P. Jones, Donald Pagach
Publisher:
Cengage Learning
Financial Accounting: The Impact on Decision Make…
Accounting
ISBN:
9781305654174
Author:
Gary A. Porter, Curtis L. Norton
Publisher:
Cengage Learning

Cornerstones of Financial Accounting
Accounting
ISBN:
9781337690881
Author:
Jay Rich, Jeff Jones
Publisher:
Cengage Learning